Viewing results and calculating (ambient) dose equivalent

Dear FLUKA experts,

Question 1

I am aiming to calculate a dose equivalent of x-ray spectrum passing through a shield of a chosen material and measured by a detector behind the shield.

To achieve it, I am using USRBIN (and USRTRACK) cards (for calculating dose equivalent I am considering AUXSCORE card with AMB74 parameter in the future). Fluka manual for USRBIN:

https://flukafiles.web.cern.ch/manual/chapters/description_input/description_options/usrbin.html#usrbin

specifies in Notes point 5. that the default unit of a dose original measurement result is GeV/g:
[please see att.1]

It also provides a constant to multiply by in order to obtain the result in Gy (regardless of mass). This kind of mass independence is what I would like to obtain in my dose equivalent result, too. However, in Notes point 9. the default unit is “per unit primary weight”, but it lacks this constant. Do you know the value of this constant or should I better transform my dose results in Gy to dose equivalent in Sv outside of Fluka?

My particles are photons (30-140 kVp) and my tissue in dose equivalent (different from material of my shield and of my detector) is human body.

Question 2

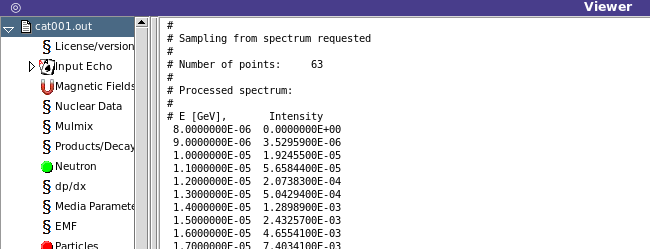
As a beam source I am using energy histogram: set of energy values with their intensities (see histogram_71kVp.txt attached). I would like to obtain a similar data (2 columns of data: each energy with its corresponding intensity) in “output” of the simulation = in detector area behind the shield.

Could you please advise if such data is visible somewhere in .out or .bnn result file? I would be grateful for indicating the exact place. I have found my “input” data (which has same values as my input source histogram):
[please see att.2]

but cannot find similar “output” data.

Question 3

I obtained (after merging results from particular Cycles with Process button) four files with results data:
[please see att.3]

Files sum.lis and tab.lis are accesible with Viewer button. What concerns me - in relation to question 2 - is that there are no physically meaningful results with E below 71 keV, but non-zero:
[please see att.4 to att.6]

Could you please provide a hint what may be wrong in my code (attached)? “Input” source data - as presented above - do get implemented correctly, but “output” results seem not to be calculated. Perhaps some parameters (“Unit”?) in scoring cards should be chosen differently:
[please see att.7]

I would be grateful for some advice and would like to excuse should some questions be obvious, since this is my first simulation in Fluka.

cat.flair (1.3 KB)
cat.inp (1.6 KB)
cat.out (1.9 KB)
source_newgen.f (20.8 KB)
histogram_71kVp.txt (890 Bytes)

att.2

att.4


att.7

Hello Aleksander,

let me answer your first question: absorbed dose and dose equivalent are defined as the amount of ionising energy deposited per unit mass. In FLUKA, the standard unit system is a modified cgs, the natural unit to express dose is GeV/g. The conversion factor 1.602… E-07 converts a dose expressed in GeV/g to one in SI-units J/Kg or Gy. Dose equivalents are also expressed in J/Kg, but they get the special name Sv (Sievert) to express that they have been weighted with an energy- and particle dependent quality factor Q to express the relative risk of different radiation types.
The next fact to take into account is, that in FLUKA, all results are expressed for one primary particle. You may run 1000 or 1.0E+06 particle histories in your simulation, the absorbed dose will be expressed in GeV/g per primary particle.
The basic definition of dose equivalent is H = Q * D, where D is the absorbed dose and Q the quality factor, depending on particle type and energy. A more practical formulation to estimate dose equivalent is to go over the fluence spectrum of the radiation:
H = \int \frac{d\phi(E)}{dE} h_{\phi}(E) dE

The fluence-to-dose equivalent conversion coefficient h_{\phi}(E) is published for standard radiations in ICRU Report 57/ ICRP Publication 74 and for high-energy particles and radiations in a series of papers by Pelliccioni and Ferrari in Rad. Prot. Dosim. It is built-in to FLUKA and accessible when calling the AUXSCORE/ AMB74 modifier to a fluence estimator in USRBIN. Internally, for each history, the USRBIN / AUXSCORE-routine evaluates the fluence in the volume of interest, multiplies it with the conversion coefficient at the right energy and adds the result to a total which is finally divided by the number of histories. Footnote 9 states that in this case, the result will be in units of pSv (per primary particle) and that you don’t have to convert anything else to obtain a result in SI-units.

Alternatively, you could score the differential fluence spectrum with USRTRACK and multiply it, in an offline-program, energy by energy with the fluence-to-dose equivalent conversion coefficient that you take from literature.

USRTRACK may be the answer to your question 2, if you mean fluence with “intensity”.

Finally, you made a simple error in the energy specification of the USRTRACK detector, it extends to only 1.5E-05 GeV = 15 keV. I haven’t run your code, but this one needs to be corrected if you want to see the full output fluence spectrum.

Best regards, @totto

Dear Thomas,

Thank you for your detailed explanation regarding units and definition of physical quantities used.

Regarding question 3,you were right: Emax parameter in USRTRACK should be 1.5E-04 (GeV) = 150 keV to encompass the whole energy range from the histogram source. I have adjusted it.

However, as far as I can find output data [please see att.4 to att.6 from the original message], the measurement still equal 0. Once you look at att.2, the input values (“Intensity”) are non-zero for each energy and so should be the output ones.

Could you please run the code and advise:

  1. if I am looking at the correct place or are the results displayed somewhere else?
  2. what may be the reason for 0 values for USRBIN+USRTRACK?

As you can see on att.7, the “Unit” parameters in both cards were set identical as in the flair tutorial example: Official flair site.

Dear Aleksander,

if you scroll down in the cat_51_tab.lis file, you will notice that you have non=zero results above 33 keV energy. You don’t see anything belog that because the default transport thrersholds of FLUKA, which is 100 keV for electrons/positrons and 33 keV for photons.

You can lower these limits down to 1 keV and 33 eV recpectively using the EMFCUT card with the transport and PROD-CUT types.

Cheers,
David

Dear David,

Thank you for pointing out another possible reason.

Issue no 1: finding results
Let me explain what is visible in cat_51_tab.lis file. The file contains 4 colums: the first two contain numbers from 1.0E-6 (GeV) = 1 keV to 1.5E-4 (GeV) = 150 keV (if I get it right, default energy unit in Fluka is GeV). Additionally, column no 2 contains the same numbers as column no 1, just shifted one row. Columns no 3. and 4. contain only zeros. I uploaded now screenshots of the entire file (please see tab.lis_part1 and tab.lis_part2).

Having said that, I cannot see the difference below and above 33 keV threshold which you mentioned. Could you please explain how do you read numbers present in this file? My expected results should be a histogram: roughly 70 levels of energy with their respective “intensities”/fluence, from 8 keV to 71 keV. My external beam source generates photons.

Issue no 2: setting particle threshold
I added EMFCUT card to my code as you recommended (please see attached). A few questions arise here:

  • Should “Type” parameter be set as “PROD-CUT” or “transport” (my beam source generates photon spectrum from 0 to 71 keV which is exposed to a shield and measured behind the shield)?
  • Since my beam carries photons, not electrons/positrons, I chose WHAT(2) visible as parameter “y” in the code. I set it to 1.0E-6 (GeV) = 1 keV (the real energy of the least energetic photons from the beam source is 8 keV). However, I am wondering whether this threshold should be set as high as close to initial energy, because photons’ energy will gradually decrease during interactions with the shield matter and I am not sure if such threshold will not “eliminate” photons from further simulation after their first or second interaction - which is probably too early. Please advise which value would be the most reasonable in this simulation.
  • I would like to lower minimum particle threshold within the entire simulation (from source to the detector, since the least energetic photons have <33 keV from the beginning). Therefore, I left the other fields (“Mat”, “to Mat”) blank - is it fine or should I actively control their values?
    emfcut

Dear Aleksander,

The columns in tab.lis files are the follows:

  • Lower energy boundary of the histogram’s bin
  • Higher energy boundary for the histogram’s bin
  • Scored value
  • Relative percentage error

For the threshold you need two EMFCUT cards to set both transport and PROD-CUT
types, and you need to set the electron thresholds are well to comparable energies.

Setting the threshold high would mean, that the electron/photons are not transported and not created in interactions. They energies would be deposited on the spot.

The Mat - to Mat and Reg - to Reg options are used to specify for which materials / regions are the threshold applied.

It is still not clear to me why you don’t score anything. Could you upload your cat001.out file?

Cheers,
David