In a simple water tank model, I wanna calculate the gamma rays generated by neutron inelastic scattering, elastic scattering and neutron activation. But, there are some characteristic gamma rays generated by neutron inelastic and elastic scattering disappear, while using some cards like IRRPROFI and DCYTIMES.
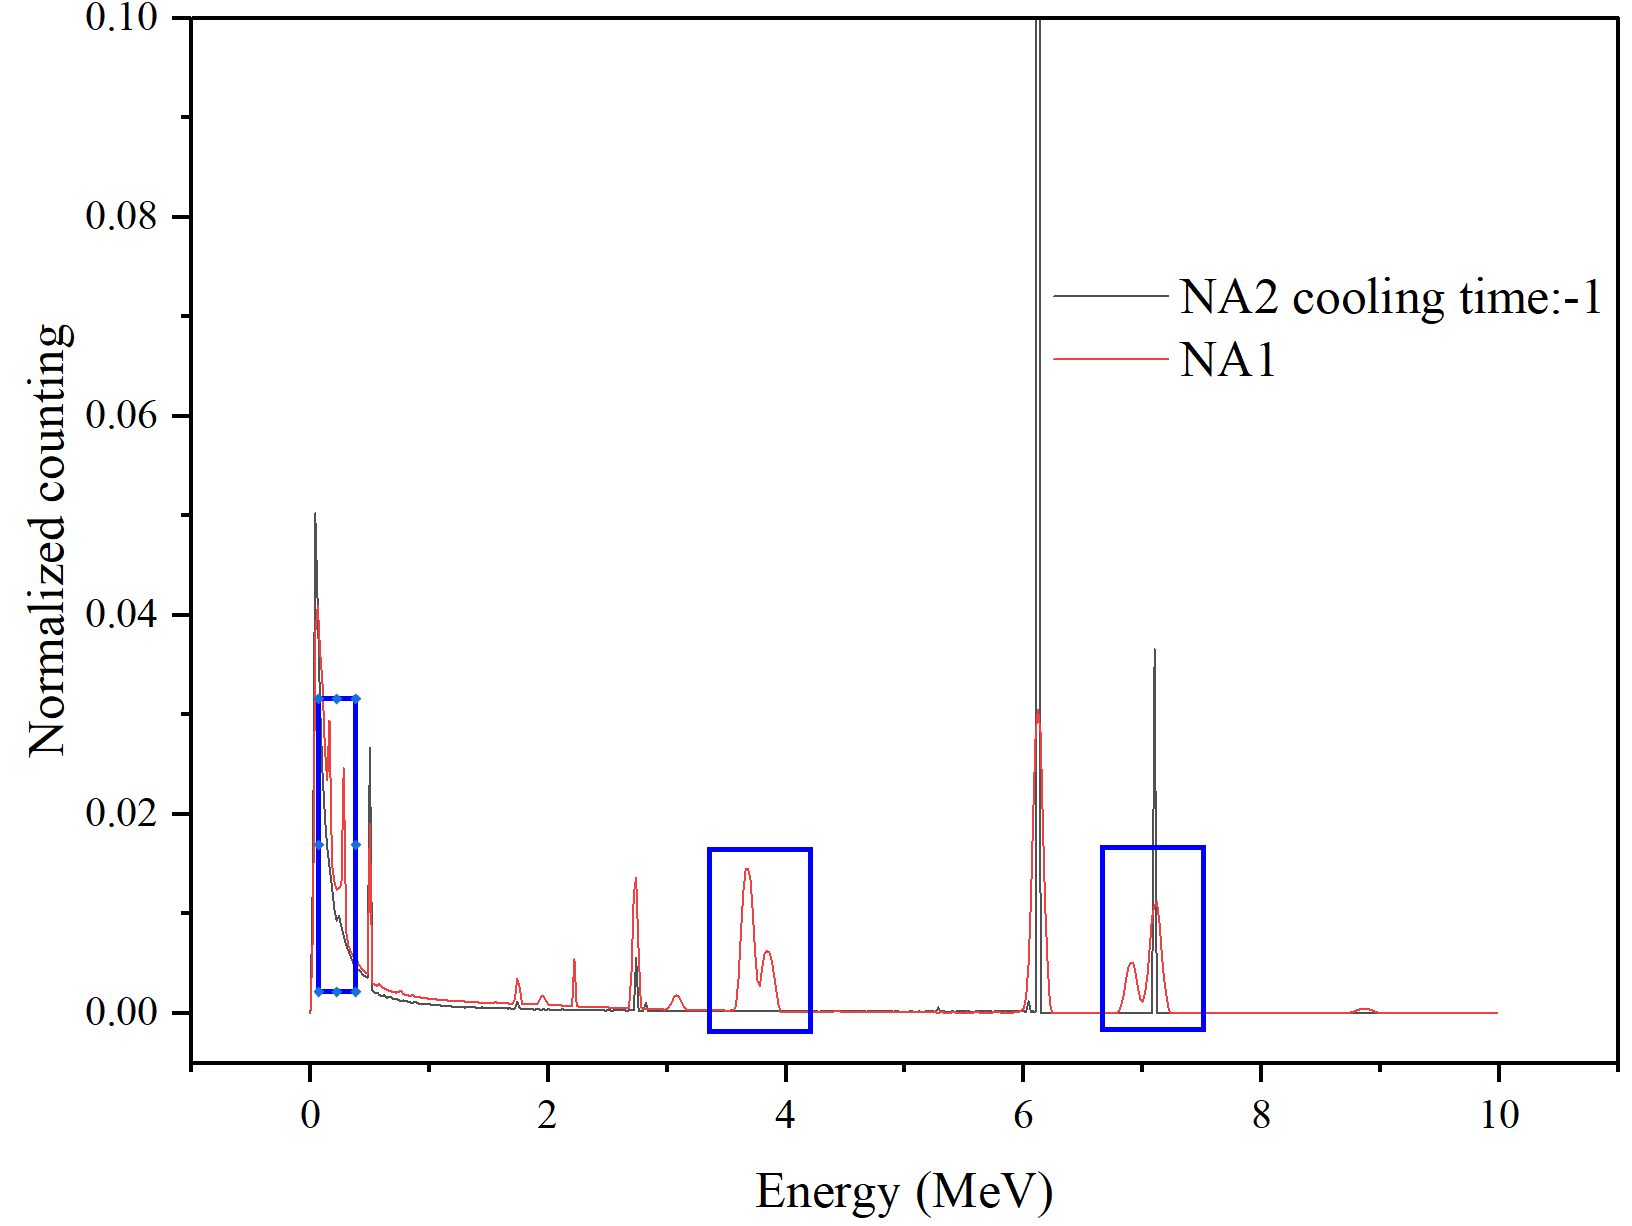
File NA1 is to simulate neutron inelastic scattering and elastic scattering energy spectrum. File NA2 is to calculate the energy spectrum after different cooling times. The result of comepare the cooling time of -1 in NA2 with result of NA1 is showing in the Fig.
When you request decay through cooling times through IRRPROFI and DCYTIMES, what you obtain is ONLY the products of the decays of your residual nuclei, ponderated by their calculated activity at your specified cooling time. There is therefore no reason to expect those two plots to be the same.
Now, why are some lines present in both plots?
In your first plot, you have the (prompt) gammas coming from the deexcitation stage of the nuclear interaction. Your reactions leave the nucleus in an excited state, and FLUKA performs the deexcitation according to our model.
In your second plot you have the gammas coming from the decays of residual nuclei.
Here is an example that illustrates why, in some cases, you can see the same lines appear.
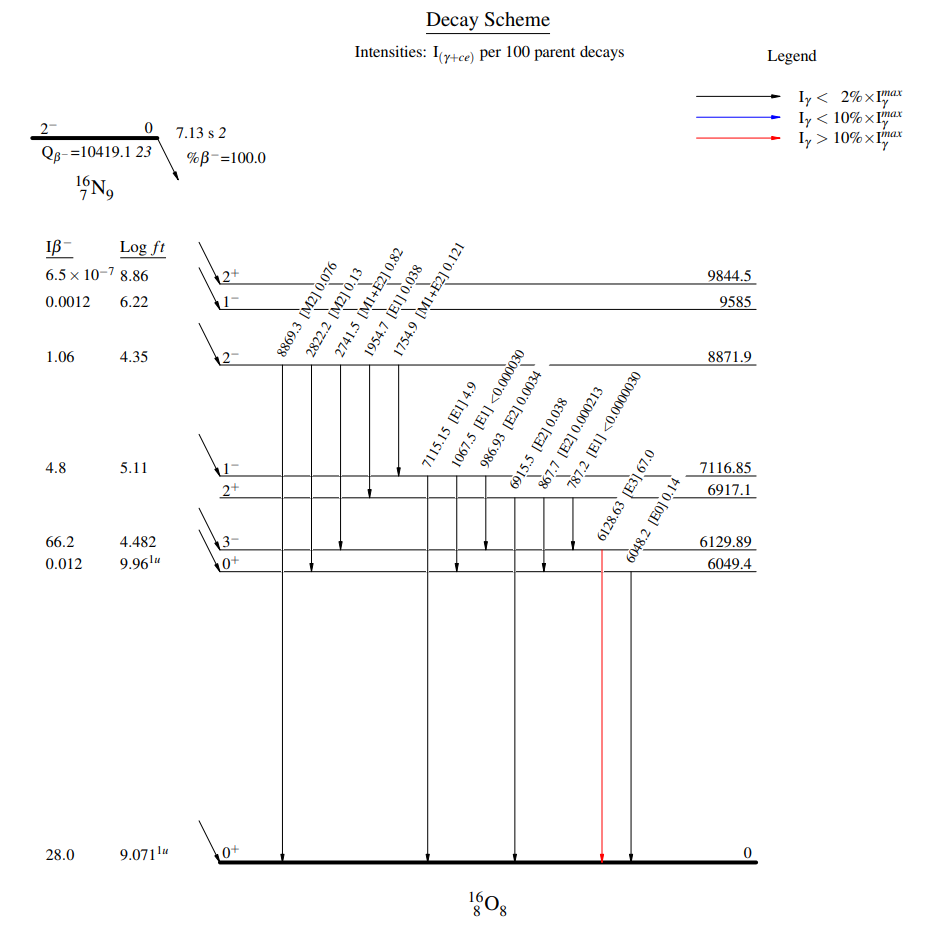
Consider 16O (n,n’) leaving 16O in an excited state. The deexcitation will lead to emission of 6.048 and 7.115 MeV (among others). You can note that the peak is also broader as we apply doppler broadening (wrt nucleus recoil) when emitting the gamma.
Now consider 16O (n,p) leaving 16N in an excited state. 16N will deexcite and then be scored as residual nuclei by FLUKA. In the decay part of the simulation, the 16N decay will be computed, as requested by your RADDECAY card. That 16N nuclide decays beta- to 16O which entails emission of those 6.048 and 7.115 MeV gammas as well, as the 16O deexcites after beta decay