Dear FLUKA Experts:
I am a beginner in FLUKA. I am simulating x-rays penetrating a sphere of silicon deposited in a scintillator of lyso. Now I have some problems and hope to get some help.
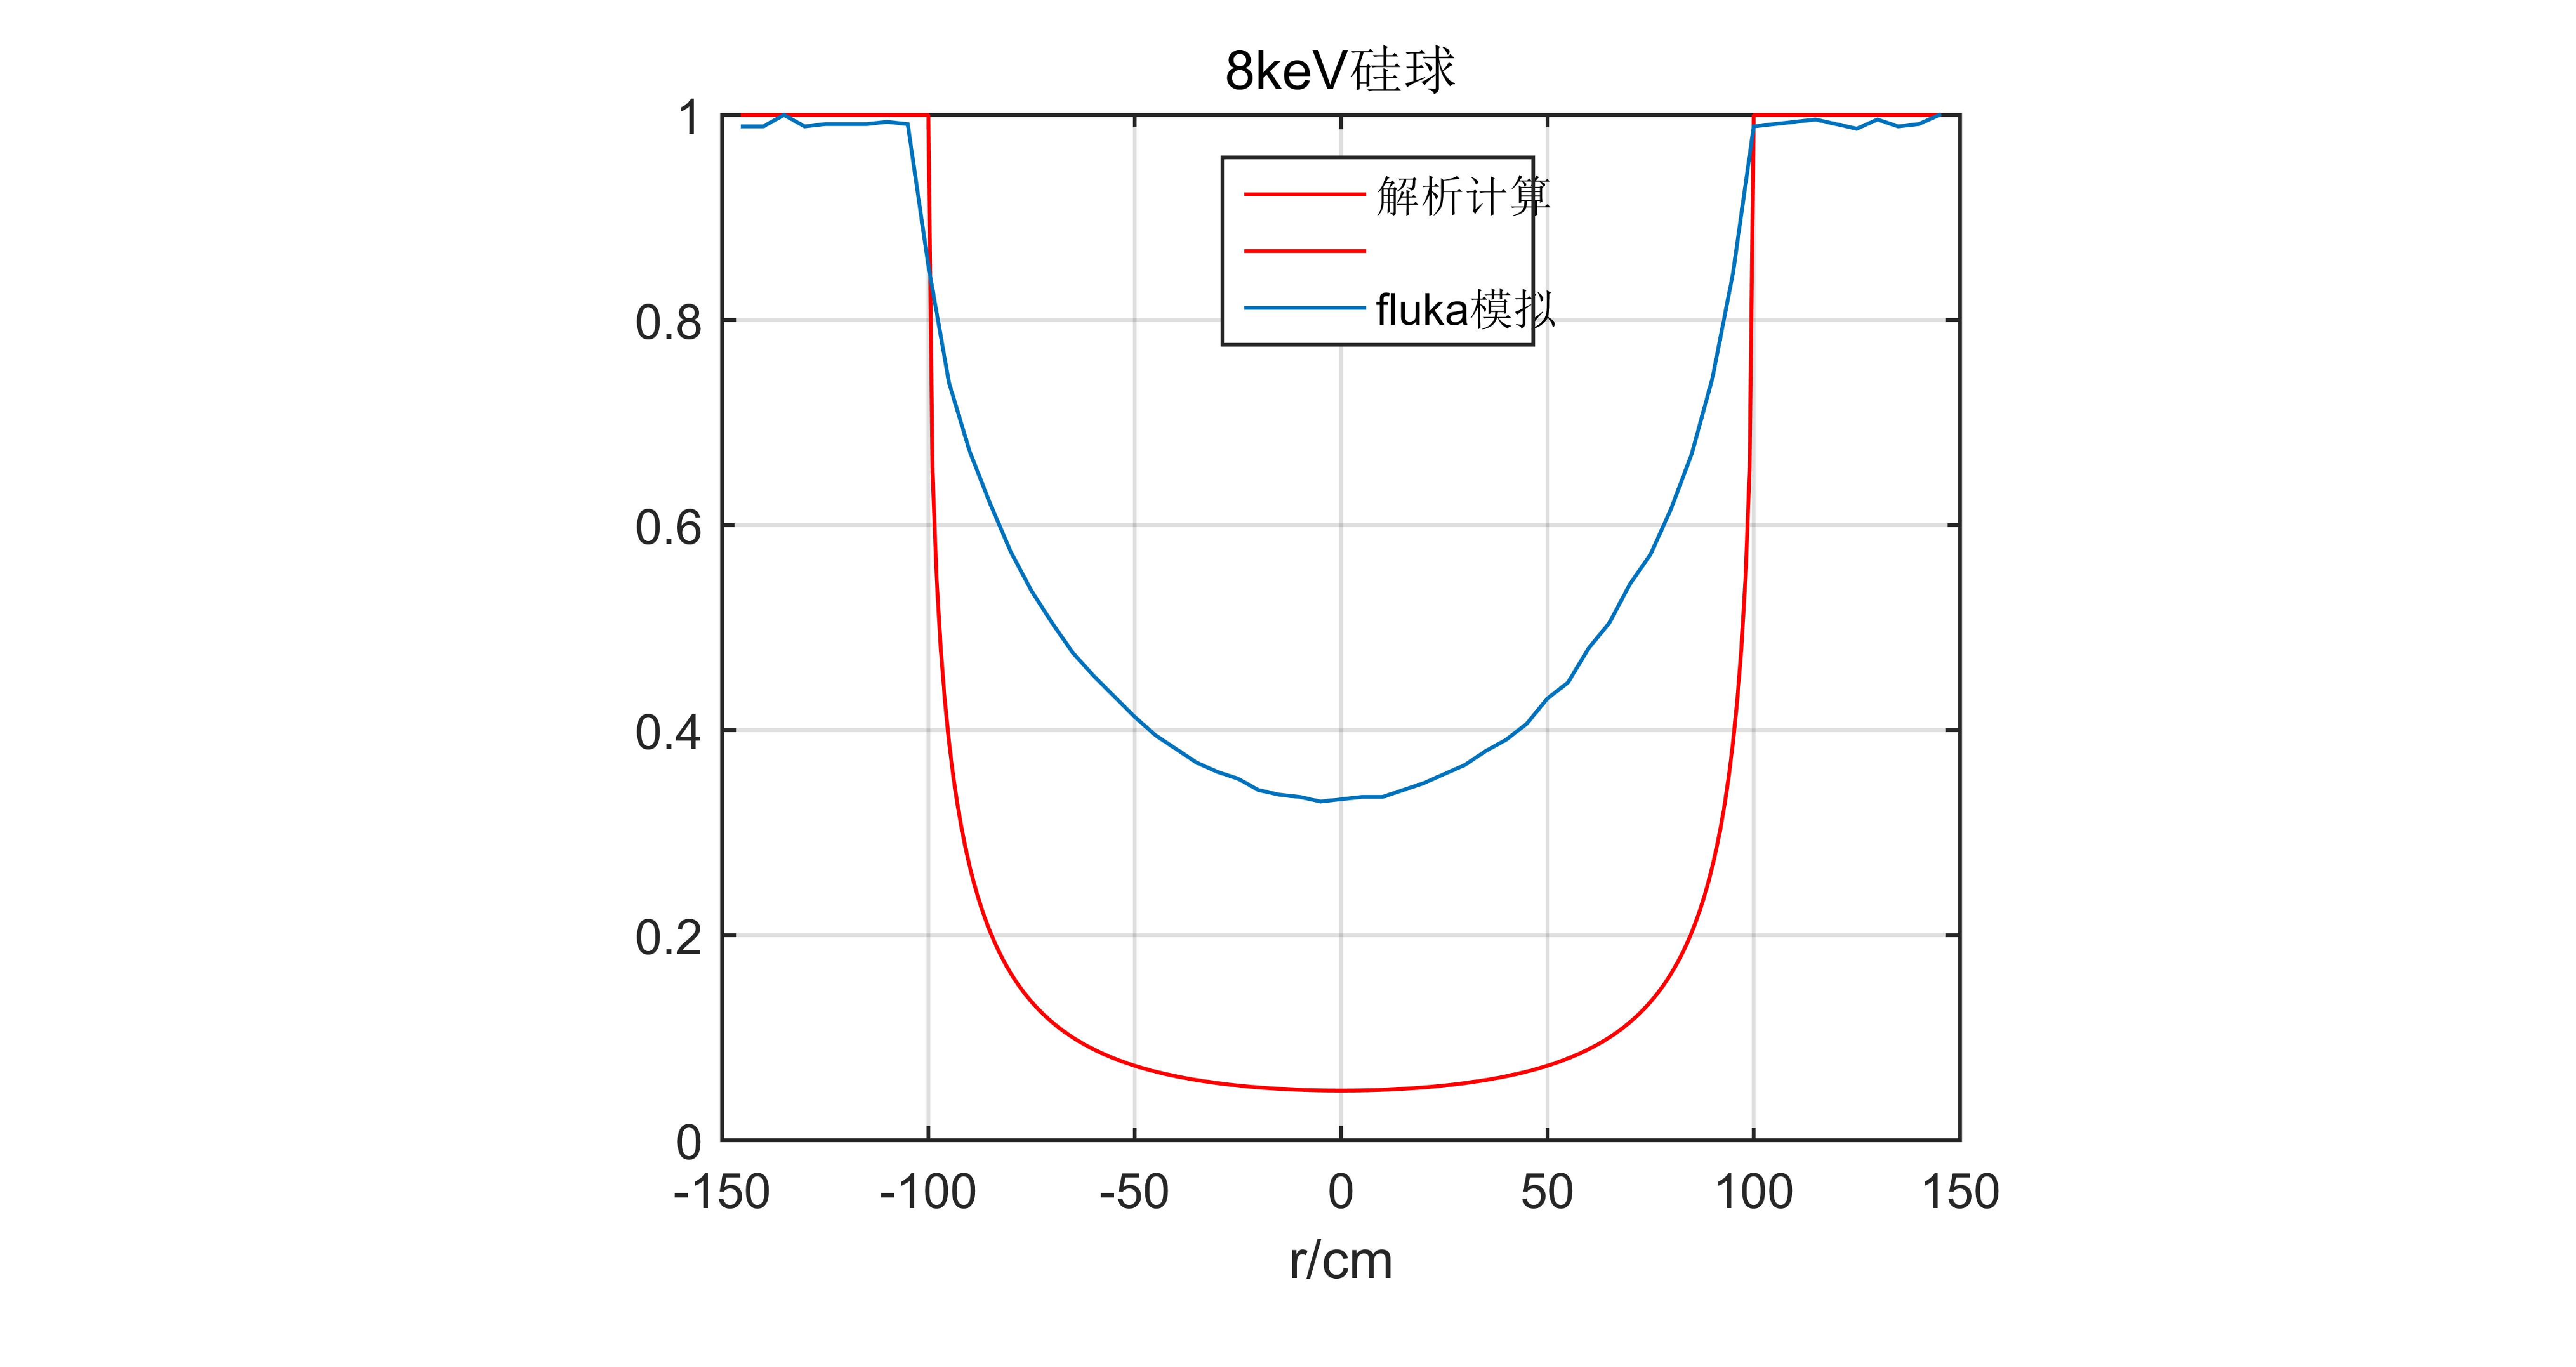
I used MATLAB to calculate the relationship curve of the total absorption characteristic of X-rays in the radial direction (the total absorption characteristic obtained by multiplying the transmittance of the ball by the deposition rate of the scintillator), and then used FLUKA for simulation to obtain the deposition energy distribution , take the 1D Projection of the y-axis, normalize it, and then compare the two images, and find that the overall data of FLUKA is larger than the result calculated by MATLAB. I would like to ask why?
If what I want to get is the transmittance of X-rays passing through the ball, how should I simulate it correctly?
If I want to get the total absorption characteristic curve of the final process of X-ray penetrating beads deposited on the scintillator, what should I do more correctly?
Because I am a beginner in FLUKA, I may not express clearly. Thanks for any tips in advance.
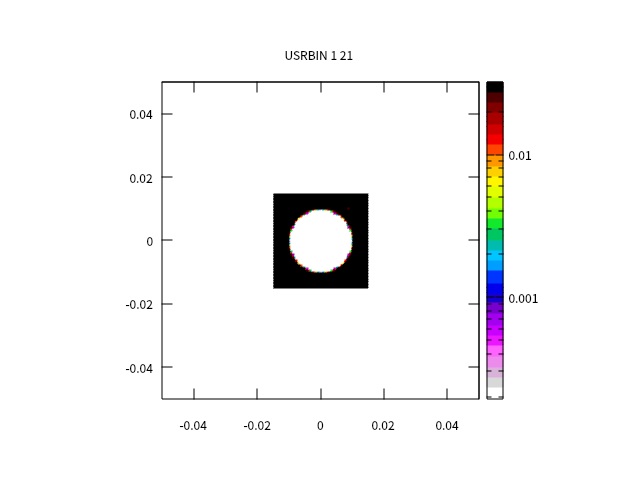
You can get the 2D distribution of the energy deposition as you did with the USRBIN. Then you make the projections on the axis you want. (I see in your following post that you did this already).
It is because of the energy of the X-ray, which is set to 8e-6 GeV = 80 keV, it is too small to penetrate the sphere material. If you increase the energy of the photons you will see that they can go through.
For what concern your second post,
The first thing I see is that the problem you are simulating is rather different from the previous one (geometry, thresholds). Please, next time, make a new post in order to keep the replies separated and better organized for future interested users.
I am afraid that I cannot comment on the comparison between MATLAB and FLUKA, since I am not familiar on how MATLAB is treating the problem.
In relation to the FLUKA questions:
The energy deposition distribution is obtained with USRBIN, as you correctly implemented. Notice that the 1D projection provides the energy deposition along the selected axis averaged over a certain range on the other two axes. For instance, if you ask for the 1D projection in Y, the curve you get is averaged over [x_min,x_max] and [z_min,z_max]. It is important that you check carefully in which range you do the projection since you may include data out of the region of interest that can contribute to the energy deposition, leading to an overestimation/underestimation.
In addition, in the plots you attached, I see that the x-axis is labelled as ‘r’, if that corresponds to the radius you may need to consider cylindrical coordinates instead of Cartesians.
I think the USRBIN you defined is correct. Check the previous point and the normalization factor.
In order to get the characteristic curve of the X-ray penetrating a material you need to obtain the energy spectrum. To do so, either define a USRTRACK in a region or a URYIELD in a boundary crossing (please check the manual for further information).