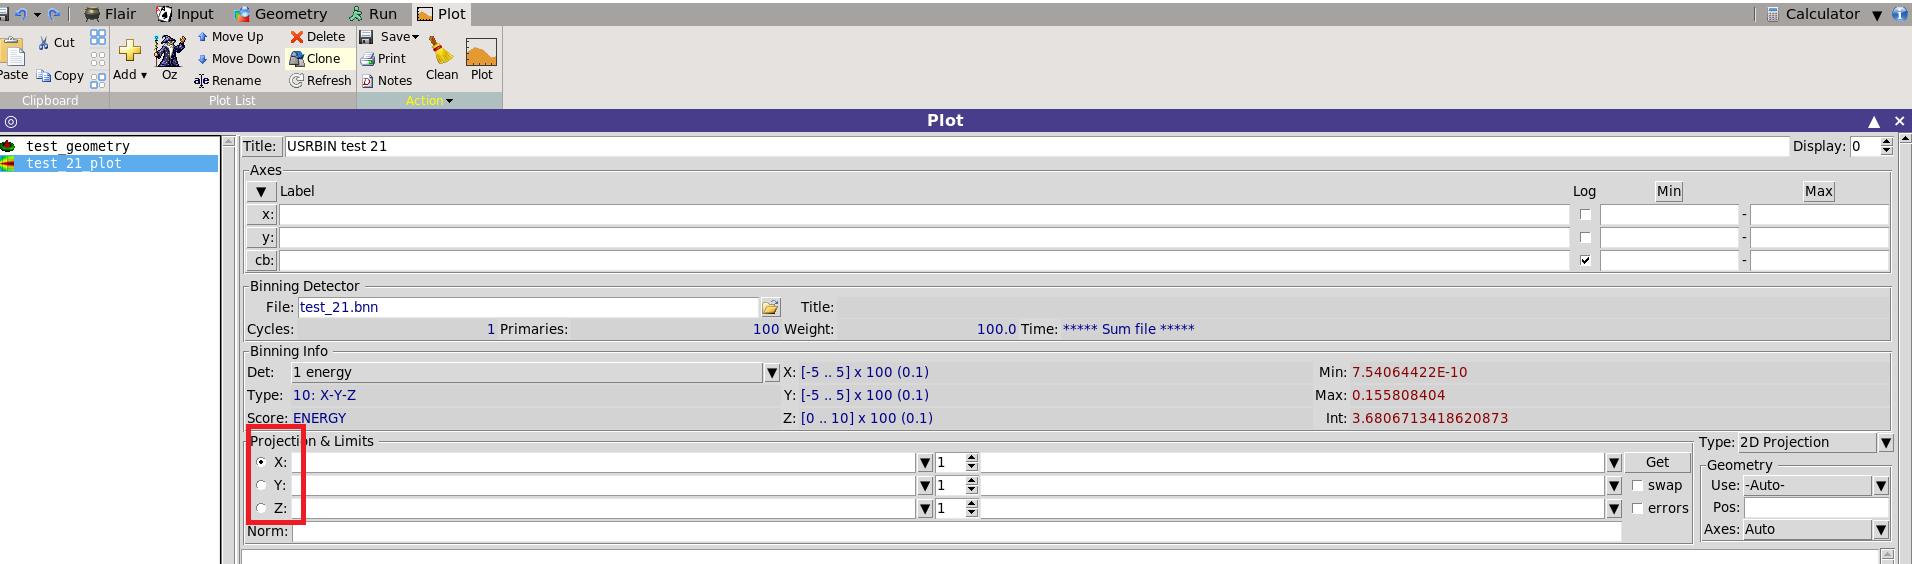
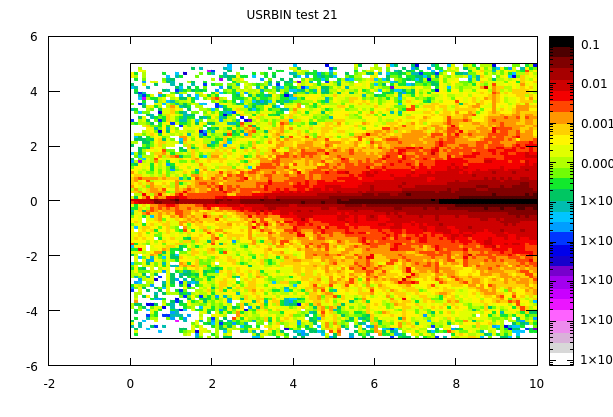
If I understand correctly your need, you can have a look to the different options available in the “Plot” tab at Flair. Particularly, the section “Projections & Limits” allows to choose what plane is plotted (see attached picture “plot_tab”). The default option is the Z bullet point which plots, as you said, the average result of the Z axis on the X-Y plane. Should you select the X point, you will obtain the average result of the X-axis on the Y-Z plane. As an example, see the pictures “xy_plane” and “yz_plane” which come from the default input file + USRBIN card.
Thank you for your reply.
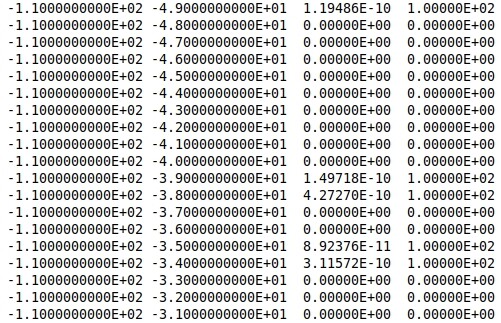
I know how to get graphic results for different planes, I want to know how to get data results for different planes as shown below?