Description: Analysis of Gamma-Spectra from NaI and Radiative Capture Reactions
I hope you are all doing well.
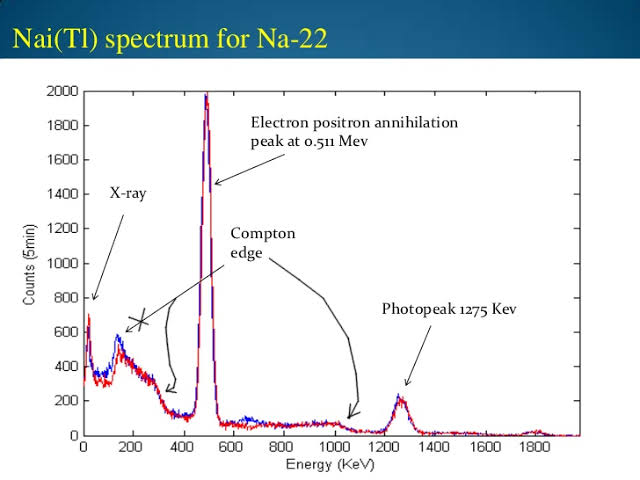
I am currently working on the simulation and calibration of a NaI detector. While exploring the user forum, I found an excellent example concerning the [Na-22 511 keV to 1274 keV peak ratio]. After making some modifications to the detector geometry, I was able to obtain the expected photo-peaks for Cs-137, Co-60, and Na-22.
However, I have noticed a discrepancy in my results. Specifically, the spectra do not appear to show the expected Compton scattering or X-ray peaks. I am unsure whether these features were intentionally excluded in the original example or whether I need to increase the simulation statistics and runtime to observe them properly.
I would greatly appreciate any guidance on the next steps for this work. If there are any shortcomings, uncertainties, or potential errors in my simulation setup, I would be very grateful for your suggestions on how to improve and validate the results.
In addition, I would like to know whether it is possible in FLUKA to simulate the irradiation of a sample with a proton beam by defining the proton energy and irradiation time. My interest is particularly in studying proton-capture reactions and their resulting gamma emissions and for that of course reshaping geometry will be required.
As a longer-term goal, I intend to proceed toward PIGE (Proton-Induced Gamma-ray Emission) analysis after completing the NaI detector simulation. While reviewing discussions on this forum, I found references indicating that FLUKA is not capable of performing PIXE simulations. I would therefore like to ask whether the same limitation applies to PIGE studies, or if FLUKA can be used reliably for proton-induced gamma emission analyses.
Thank you very much for your time and assistance. I look forward to your valuable advice and suggestions.
I can comment on the gamma-ray spectroscopy part of your question. First of all -by selecting the “EM-CASCA” DEFAULT- the simulation is correctly set up for creating the expected features in the spectrum (photopeaks, Compton edges, x rays, …). I verified this by running your input file (with higher statistics, see below).
The “discrepancies” with the attached spectrum are probably caused by differences in the geometry as in the forum post by Hakan Cetinkaya that you linked. The answer to that post is actually fully applicable here, I am just adding some more information.
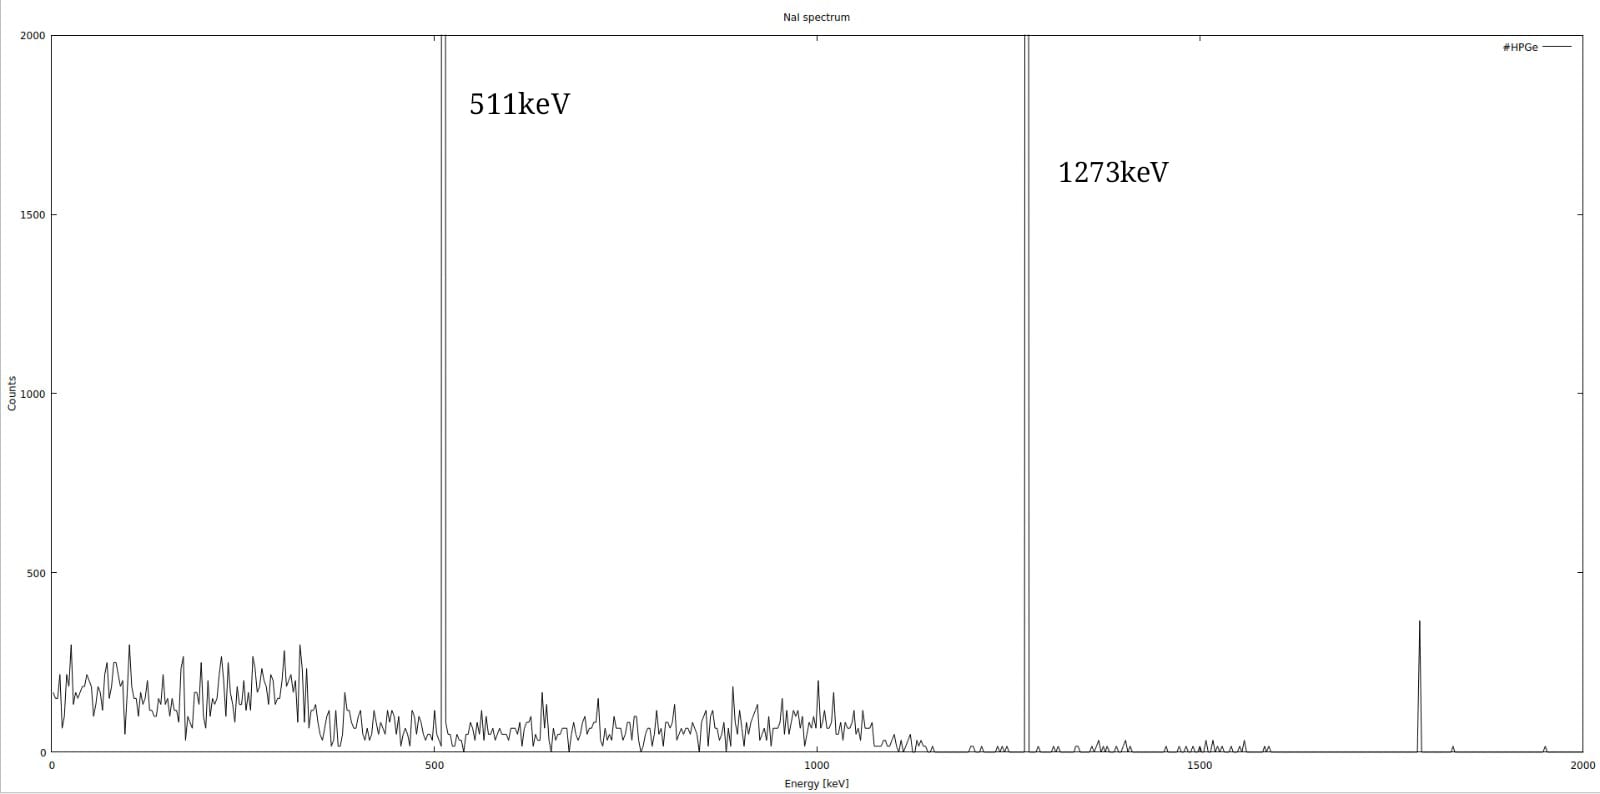
From that post (and the names of the input files), I assume that a simulation for a HPGe detector was turned into a simulation of a NaI detector by simply changing the material of the detector region. This results in an unusually large (from my experience) and very efficient NaI detector, which causes the 511-keV and 1275-keV peaks to be of comparable height: The crystal is sufficiently thick so that even a 1275-keV gamma ray has a high chance of depositing its entire energy.
For the same reason, x-ray lines -originating either from the detector encapsulation or the crystal itself- in the spectrum are suppressed: In the present geometry, it is unlikely for 1) a primary gamma ray to create fluorescence photons and leave the detector again without further energy depositions 2) a secondary particle to create fluorescence photons without any previous energy depositions in the crystal.
When I re-ran your simulation, I had to use a factor of 10 higher statistics to see evidence of x-ray fluorescence. I still did not see lines around 30 keV (iodine x rays!) in the spectrum, but I found lines at 511 keV - ~30 keV and 1275 - ~30 keV where the background is lower. This shows that the x-ray fluorescence process is being simulated.
I guess that the detector that was used to record the attached spectrum was considerably smaller (which would explain the 511-keV-to-1275-keV peak ratio) and that the geometry possibly contained more material around the detector or dead layers inside the crystal where fluorescence x rays could be generated.
Your remarks are truly valuable and highly appreciated. First of all, thank you for providing such helpful insights regarding the Compton spectrum and the photopeaks. Your explanation clarified several important aspects for me.
Secondly, you are absolutely right - the current detector simulation is based primarily on the NaI crystal, while the overall detector geometry is still not entirely satisfactory. I am currently working on improving and refining the geometry. The crystal thickness is, of course, another crucial factor. Initially, I was also quite confused because, with our real NaI detector, it took almost a week just to properly calibrate a single peak, whereas FLUKA was producing such clean and well-defined peaks.
However, I now have a much clearer framework for the simulation. I will share it with you - the updated geometry is based on this detector design.
Lastly, is it possible if you can share me your Fluka file, it will help me to refine my approach.
The reason why the peaks in FLUKA are so clean and well defined is of course also the fact that the DETECTOR card does not blur the energy depositions like a real detector would. In order to reproduce the shape of the experimental spectrum exactly, you would need to use the DETGEB card or post process the output somehow.
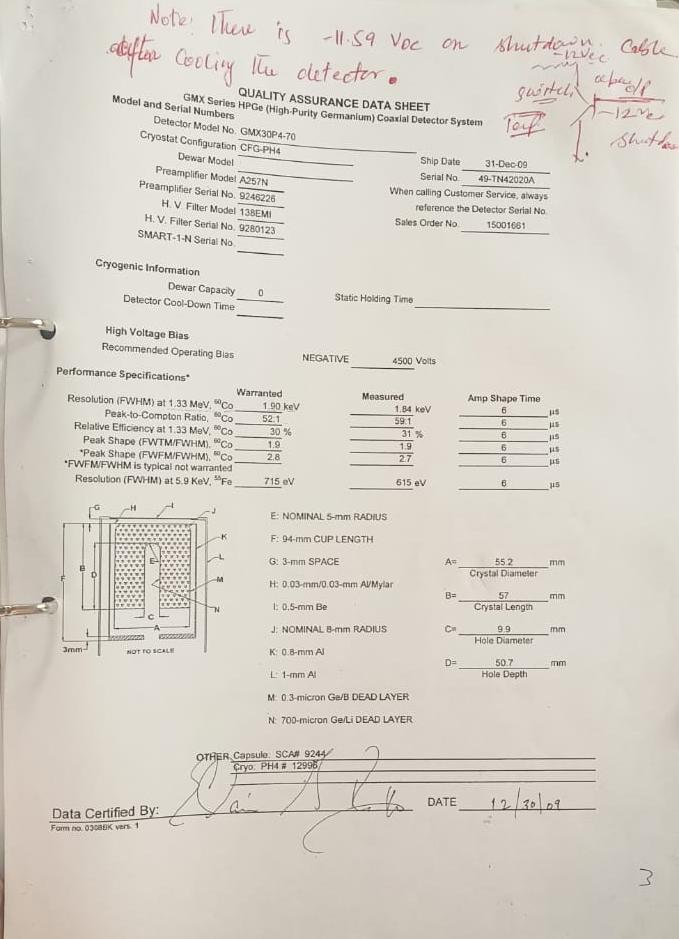
I noticed that the data sheet you shared with us is for a HPGe detector, although your original question was on NaI. Did you send the correct sheet? In any case, what we are discussing here is sufficiently general.
For HPGe detectors, the typical accuracy of simulations, expressed by
is on the order of 10% -usually overestimated by the simulation- or worse, when you simply implement the information in datasheets of this type. The problem is almost always incomplete knowledge of the geometry, not the simulation framework. It gets worse with the age of the detector. I am not saying this to discourage you from asking questions on the FLUKA forum, of course, but because I have worked a little on this. People have different tricks to get better agreement between simulation and experiment. See, for example, this paper (paywall, but the quote is from the abstract):
We also found a large discrepancy between experimental and simulated efficiency for some older HPGe detectors, which could be remedied by introducing a large dead region around the inner core.
Maybe you are not even interested in efficiencies, but I just wanted to point out the problem with the detector geometries and possible solutions.
I literally just changed a single number in the FLUKA file you posted (increase statistics by a factor of 10), nothing to share here
Yes correct the data sheet is indeed for HPGe which is my another main goal but my first focus is on NaI, what i was conveying is that for NaI I do not have any geometry to follow like the one I have for HPGe mentioning Crystal length/diameter and detector design.
Thanks for this .
Efficiency is also part of this simulation but not on that track yet.
Over all thanks alot for your help, it means alot and if you got any example that could help my problem please feel free to share it with me.