I have been advancing in my work and now I am trying to work with cosmic rays at the surface of the earth, more specifically, muons.
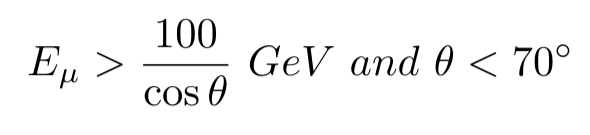
I have a approximation formula for muons at the surface, but because of the forum rules I think I can’t post the original material. The conditions for the approximation to work are as follow:
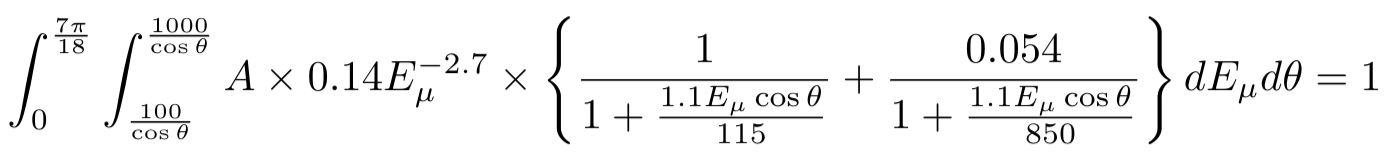
But, I don’t know who you can get the inverse CDF from this with two separate random numbers.
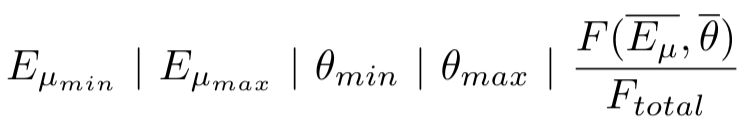
One solution to overcome this analytical problem, with discretization. You can set up a binning in energy and angle. Then using these you can create a table with the following 5 columns: E_\mu min, E_\mu max, \theta min, \theta max, and the calculated value based on the average energy and angle of the bin as relative “probabilities”.
Then you can use a random number to select a line based on the probabilities, and finally you can sample an exact energy and angle value based bin boundaries.
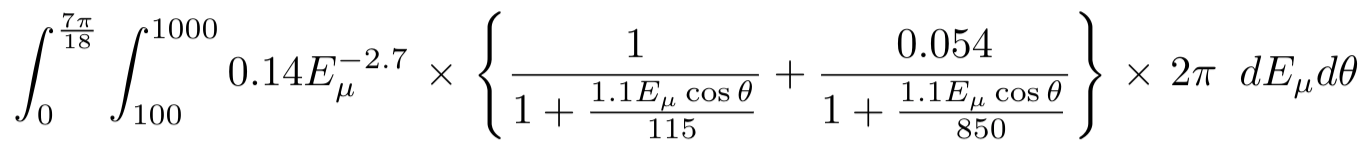
Where \Delta_E and \Delta_{\theta} are the bin width for muon energy and angle respectively.
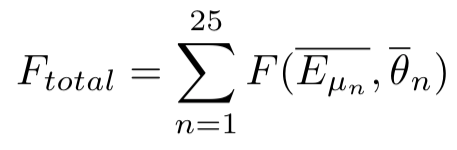
Then
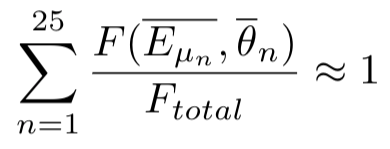
Here I have divided the Energy and Angle variables into 25 bins (n=25) for simplicity.
I would like to know: is the fifth column that you refer as “probability” in your previous message my sixth column?
and not as the actual integral, to get the total probability exactly 1.0.
Finally, your 5th and 6th columns are redundant. The calculation of F_{total} and the normalization, can be done automatically in the source routine. Furthermore, even the whole table can be generated automatically if you prefer. Then you can only supply the source routine the minimum and maximum values and number of bins for E_{\mu} and \theta.
Now I would sample \xi from an uniform distribution, I then would compare the value of \xi with another variable which would be the “accumulated probability” to chose a row. Is this correct? I attach my source.f if you could take a look.
Also I don’t understand what do you mean by sampling using the energy and angle from the bin boundaries. If you could give me extra clarification on that I would appreciate it.
by automatically, I mean instead of using excel (or something else) to create the table, you can calculate the energy / angle steps and “probabilities”.
Please have a look at the function sample_histogram_momentum_energy() in source_library.inc located in the <path_to_fluka>/include/ directory.
You should make sure, that you only read once from your file, not on every call to the source routine. To achieve this, take a look hot the first_run variable is used in the mentioned function.
From sample_histogram_momentum_energy(char,char):
I don’t quite understand how the variable scale_factor works. Is It being converted from a character to a double precision variable? If yes then couldnt I just define it as sample_histogram_momentum_energy(char,double) in my function?
I did heavily modify my code to get it closer to the function you told me to look at, but I am still using my 5 column .txt file.
I attach all my files, if you could take a look at them I would appreciate it.
the scale_factor variable and the unit conversion functions were only implemented, to allow inexperienced users covert easily the energy unit of the source file.
Since you are writing your own code, and your energies are already in GeV, there is no need to add this feature.
I also made same changes to your routine: muonsatsurface.f (6.1 KB)
The biggest one is since you want to return two values, I converted the function to a subroutine
I removed the recursive call. I was there only to protect against returning non positive energy.
There is no problem using the probabilities from the file, but you need to keep in mind, that the sum of them has to be 1.0. You could implement a check, or add a normalization step.