Would it be the same if I used the following source (I added only momentum_energy = sample_histogram_momentum_energy( “neutron_spectrum2.txt”, “eV” )
on line 299) with the corresponding input file for the spectrum? source_newgen_hist.f (18.9 KB) neutron_spectrum2.txt (3.8 KB)
The results would be similar, but not the same. It would underestimate the bins where the derivative of the intensity is positive, while overestimate where it is negative.
Also, the minimum and maximum energy values of the neighboring bins should numerically match.
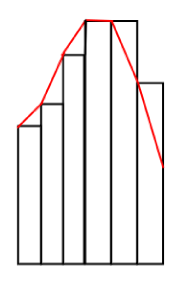
The red line represent the spectrum, while the black boxes a histogram created from the sprectrum. As you can see the area below the sections of red line and under the histogram bins are not equal, When the intensity in increasing the area below the red segment is greater, and when the intensity in decreasing it is lower than in the matching histogram bin.
This distorts the final probabilities used in the energy sampling, but the question is how much.
A different (maybe better) approach for the conversion would be to set up the histogram bins in a way, where the energies specified in the spectrum files would be at the center of each bin.