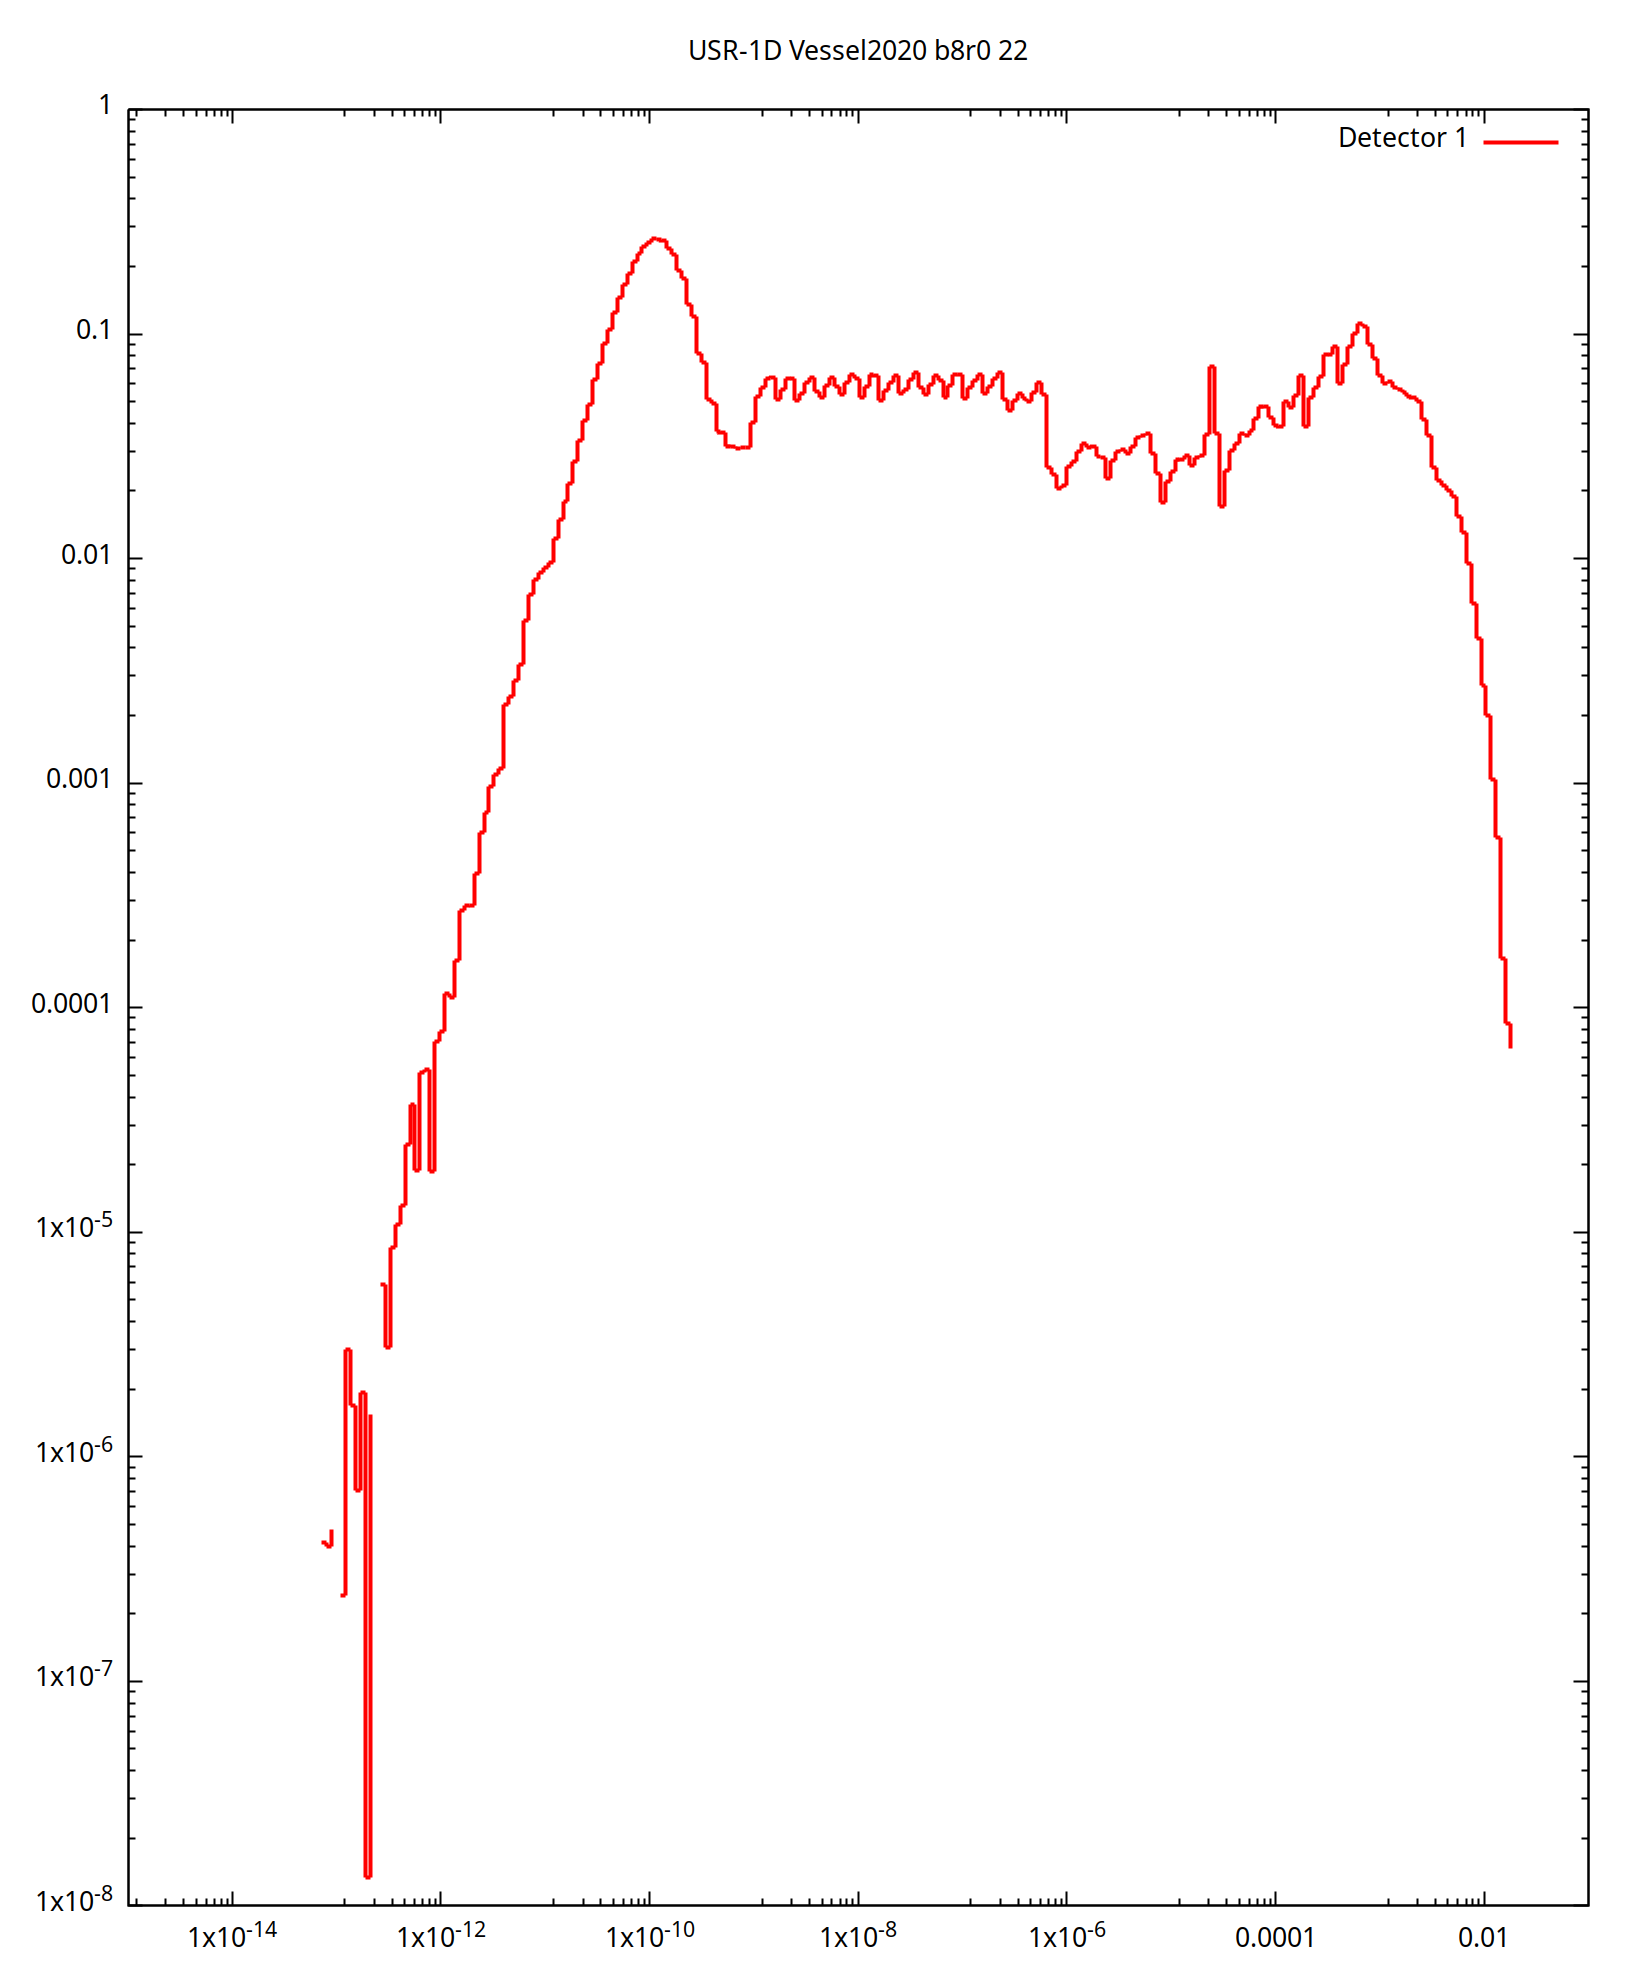
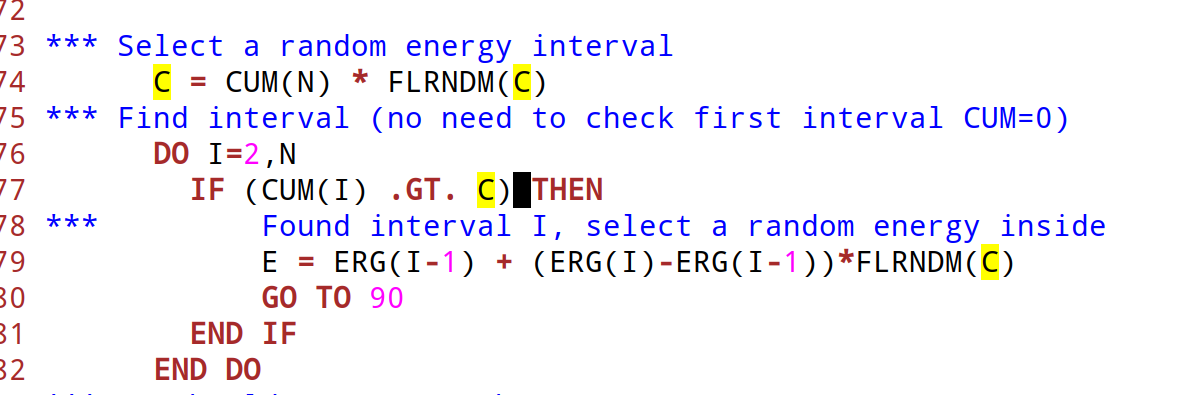
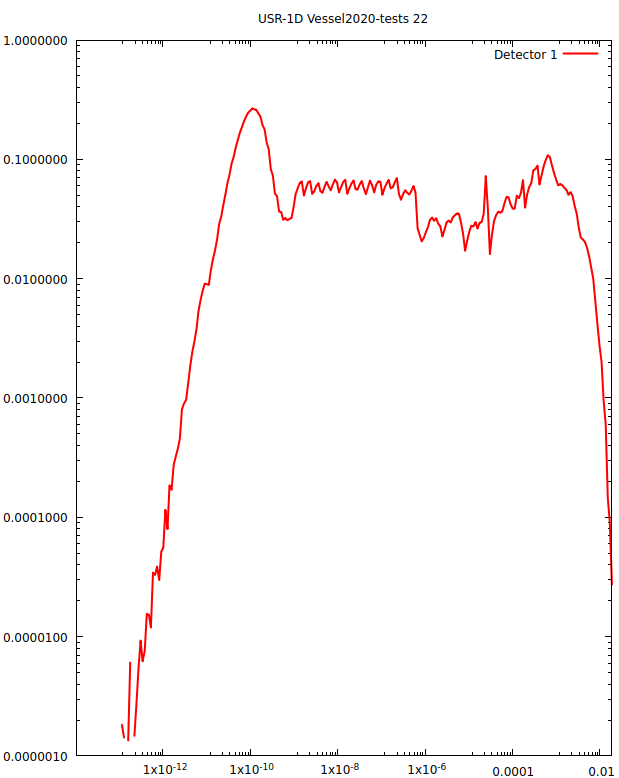
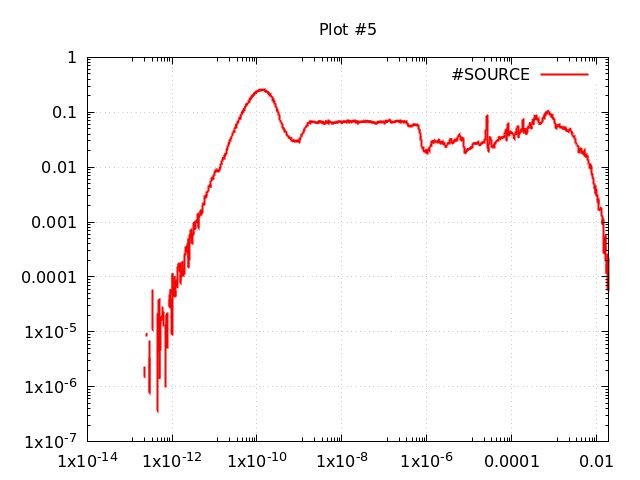
Discrepancy on DPA-NRT vs ARC-DPA in IRON using LOW-PWXS

Vessel2020_b8r0.inp (4.2 KB)
IRSNVessel2020.dat (2.7 KB)
hsource2022.f (10.3 KB)

Dear FLUKA experts,

I would like to report a strange finding concerning a dpa study I did as a continuation of the topic: DPA evaluation using SFLOOD in source.f

I provide the appropriate files to run the simulation…
In principle, from a differential normalized reactor spectrum as given in the dat file, I am doing a sampling with the source routine invoking the SFLOOD function in order to have an homogeneously distributed and isotropic neutron source in the volume of the 1 cm sphere made of IRON.

The results of the simulation using the dpa fluka input cards are given in the picture above… On the right side is without using the LOW-PWXS where the lethargic spectra is the correct one obtained in the reactor…
On the other hand, On the left side of the picture, the lethargic plot is wrong!!!
Why such a discrepancy?
From literature, I should expect in any of the 2 cases for IRON, the DPA-NRT to be about 3 times higher than the ARC-DPA.

Could you please have a look and let me know what is wrong?

Thanks a lot in advance

Best regards

Georgios

Dear @tsiledak

the difference in the two plots is due to the type of scoring you have requested in the USRTRACK


You requested Linear historgram from 10ueV to 20MeV in 260bins

  • In the GW fluka for neutrons it will create a Linear histogram from the Emin to Emax in 260 bins however it will keep only the bins above 20MeV (in your case None), and below 20MeV it will be forced to create one bin per neutron group. Therefore another 260bins with variable size
  • In the PW, it will create a true linear histogram from Emin to Emax with 260 bins, therefore the first bin will extend from Emin up to 77keV, which appear in your plot as a single line.

Change the USRTRACK to Log and you will get the expected spectrum


BTW your spectrum look weird (strange jumps and ripples), I would guess:

  • ripples could be cause dby some problem in the interpolation of your sampling
  • jumps: like the one at few eV, maybe you are dealing with a groups of variable length and not a histogram with fixed interval (log or linear)?

Concerning the DPA

  • GW: fluka is based on the NIEL (Non-Ionizing Energy Loss) information as provided by NJOY when the cross sections was prepared. And there is no way define differentiate between NRT, ARC and SCO. So all of them give the same value
  • PW: fluka will generate explicitly all recoils and they will be used to score the DPA depending the method you asked. The ratio as it comes from FLUKA NRT/ARC ~= is about 2.3

Unfortunately DPA are subject to the implementation in the various codes, and differences can be observed.
FLUKA even for DPA-NRT it restricts the integration above the damage threshold, while many other implementations do not do that yielding in a higher value.

Other comments:

  • LOW-MAT card you are asking for IRON at 430K.
    If you don’t need the 430K you don’t need the LOW-MAT card at all
    If you need 430K for the PW. You can set the temperature in the LOW-PWXS card if needed
  • LOW-NEUT card is not needed
1 Like

the origin of the ripples is indeed the sampling

In line 179 you are sampling linearly in the ERG(I-1) … ERG(I) interval, while the correct is in isolethargic way

2 Likes

Dear Vasilis,

Thanks a lot for your valuable comments. By correcting the usrtrack card as you suggested I got the correct distribution.
By the way, the initial neutron spectrum is:

then, I convert it to a differential one and normalize it and import it in the input as a IRSNVessel2020.dat (attached in my first post).
If I need to sample it in an isolethargic way, is it sufficient just in the line 179 to get the Log of the ERG values?
In addition, from Estimation of reliable displacements-per-atom based on athermal-recombination-corrected model in radiation environments at nuclear fission, fusion, and accelerator facilities - ScienceDirect (table 3) there is a factor of > 3 for the ratio nrt_dpa/arc_dpa. In FLUKA ,the DPA-SCO is just the Stoller MD fit as described in
the respective publication:
image
while the ARC-DPA the Nordlund fit?
The ratio of ~3 between of NRT and ARC or MD (Stoller) that is calculated by other codes has to do with the limited and simplified NJOY model that they widely use concerning the damage estimation?

Thanks a lot in advance

Best regards

Georgios

Neutron Fluence

  • To correct the ripples you need to sample flat in log space inside each interval at line 179.
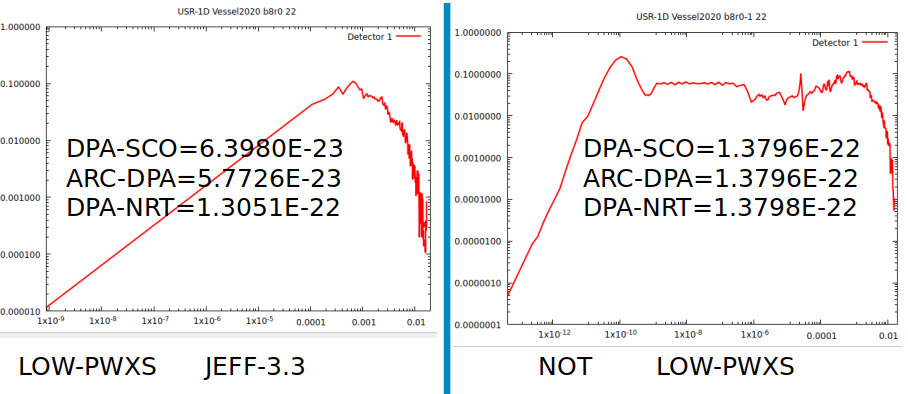
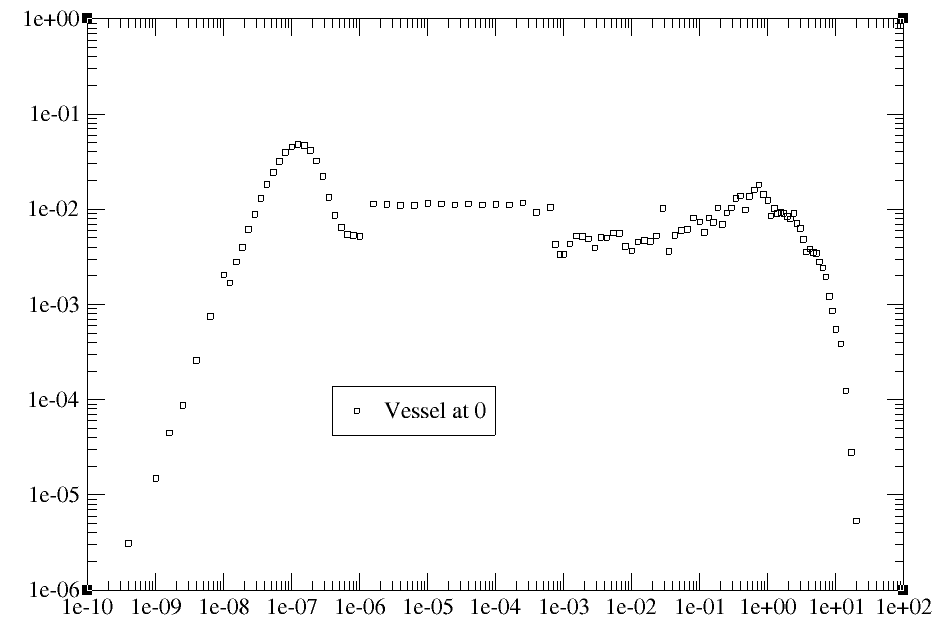
  • In the neutron fluence, the step between ~1eV to 1keV is suspicious, I would guess that the spectrum is a recombination from various measurements/simulations not properly normalized.

DPA
as far as I know DPA is not a unit that one can directly measure, its more like a “mathematical quantity” that gives you the possibility to compare the damage effect on macroscopic quantities induced by different irradiation fields/conditions.

The most accurate calculation of DPA one can make, is with Molecular Dynamic codes, counting the individual Frenkel pairs. Monte Carlo codes using condensed history and tracking down to a certain energy, do not take into account the development of a cascade after a primary knocked out atom (PKA), and use some approximate ways of calculating it.

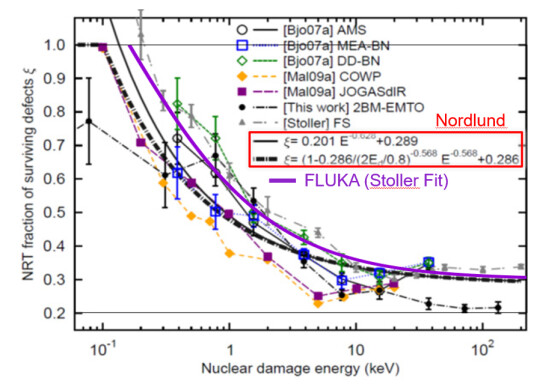
The work of Nordlund was addressing that by measuring the effect on macroscopic quantities vs the calculated DPA-NRT for various PKA, and he made a fit on the results as a reduction factor to be applied on the DPA-NRT. The difference mainly comes from the overlapping of the various cascade branches, and its more pronounced the higher the PKA energy is.

In FLUKA:
DPA-NRT: integrates the PKA recoils above the transport threshold integrates using the NRT rules (0 up to Eth, 1 up to 2Eth, and linear above). Below the PART-THRES uses the Lindhard partition function to split between nuclear (NIEL) and electronic losses, which is then converted again to DPA-NRT using the same rule

DPA-SCO: was a invention, a pioneering work of FLUKA (long time before the ARC-DPA). In contrast to the simplistic NRT model, it was calculating the restricted recoils above damage threshold, and instead of applying a fixed efficiency of 0.8 (from NRT), its using a variable efficiency a fit as function of the PKA based on the MD simulations of Stoller, in order to take into account the recombination due to branch overlaps.

ARC-DPA: athermal recombination DPA is using the Nordlund fit, instead of the Stoller plus the discretization for 1,2 damage thresholds.

However since ALL the above including the “standard” are subject to the implementation in the MC worls, so the factor 3 you are quoting should not be used literally.
Personally I would only trust the order of magnitude of the DPA and not the exact value (not only from FLUKA but from every code), especially if one looks also on how the damage threshold is estimated and the huge variations you can find for the same material.

1 Like

Dear Vasilis, I am really grateful for all info you provided…
Concerning the ripples in the spectrum: I corrected the source routine

by adding the following code in the place of line 179:

image

but nothing has changed in terms of the look of the spectra.
As far as I understood a constant distribution in energy log scale is needed…
Maybe its wrong what I did at the end…

Thanks a lot in advance

Best regards

Georgios

A bit screwed up parenthesis :slight_smile:
As you had it it was doing exactly the same as before
since you where doing 10**log10(x) for every number

That will work

            E = EXP(LOG(ERG(I-1)) +
     &         (LOG(ERG(I))-LOG(ERG(I-1)))*FLRNDM(C))
1 Like

Dear Georgios,

for sampling, you may want to look at the spectrum sampling feature of the source_newgen.f user routine:

source_newgen.f (7.6 KB) (Adapted to your case)
Vessel2020_b8r0_plot05

Cheers,
David

1 Like