Due to my research, I need to create a model of source distributed over some area. Namely I have a voxel model of thyroid, where I need to incorporate Iodine-131. Is it possible to create such kind of distributed source?
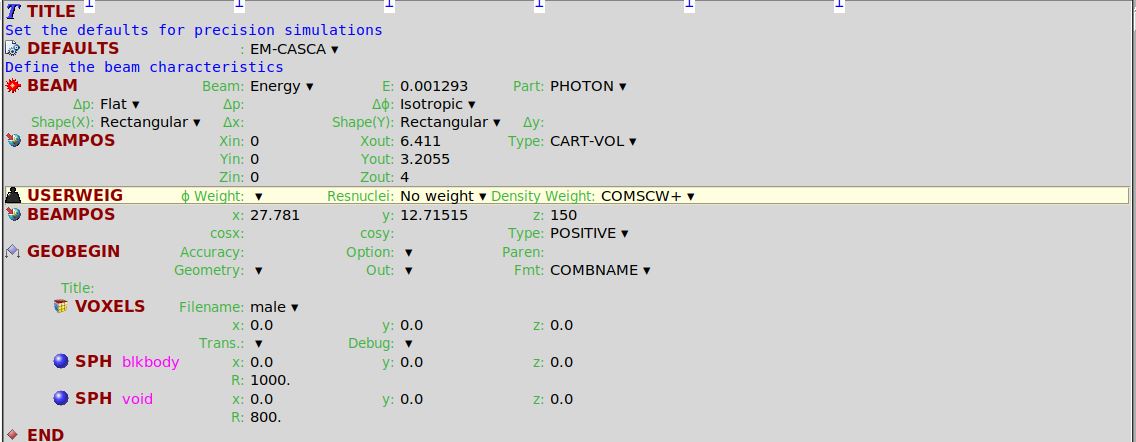
1.2. Set a CART-VOL volumetric source fully covering the thyroid. The primary particle should be PHOTON or ELECTRON, the beam energy doesn’t matter. The source should be isotropic.
1.3. With the EMF card turn the electromagnetic transport OFF. This will make FLUKA to stop every photon / electron immediately and deposit their energy where they were created.
1.4. Set up an USRBIN scoring with Cartesian coordinate system scoring ENERGY around the thyroid. The bin boundaries should match the voxels. The easiest way is to add a scoring perfectly matching the voxel geometry using Flair, and calculating from that the appropriate new values.
Or the Origin and Voxel size values shown on the same tab can be used.
1.5. Use the comscw.f user routine to discard any energy deposition where the material is not GOLD. comscw.f (5.0 KB)
1.6. Use the USERWEIG card with COMSCW+ selected at the Denisty Weight option to enable the user routine.
1.7. If you run the simulation with enough primaries, the energy deposition in each bin covering the voxels of the thyroid should be uniform.
1.8. Rename the processed USRBIN result file to source.bnn.
Using the volumetric source
2.1. Create a new Flair project. No EMF card or custom executable is needed.
2.2. Process the dicom files without any material modification to generate the normal voxel geometry.
2.3. Set the ISOTOPE source on the BEAM and HI-PROPE cards.
2.4. Copy the source.bnn created in the previous step to this project. Use the OPEN card to tell FLUKA to open it. Don’t use units below 20, the Status should be OLD.
2.5. Add a SPECSOUR card with the Type: BIN-SOUR to use the result in source.bnn as a location distribution, with the values of the bins as probabilities. For Unit use the same as you used on the OPEN card. (Maybe you will need to manually edit the card with the Ctrl+E shortcut.) For example:
2.6. Set the photon and electron transport threshold to ~ 1 keV, on the EMF-CUT cards.
2.7. Set up the scorings as you like.
2.8. Don’t forget to add the RADDECAY (semi-analogue) card to enable the isotope source and use the DCYSCORE card to associate any scoring with the decays.
Thank you for the above detailed steps, I have some quires regarding this:
why are you replacing thyroid material with gold ? Is this because gold is not present in any part of the body and we can use this as a dummy material so that we can use this in step 1.5 ?
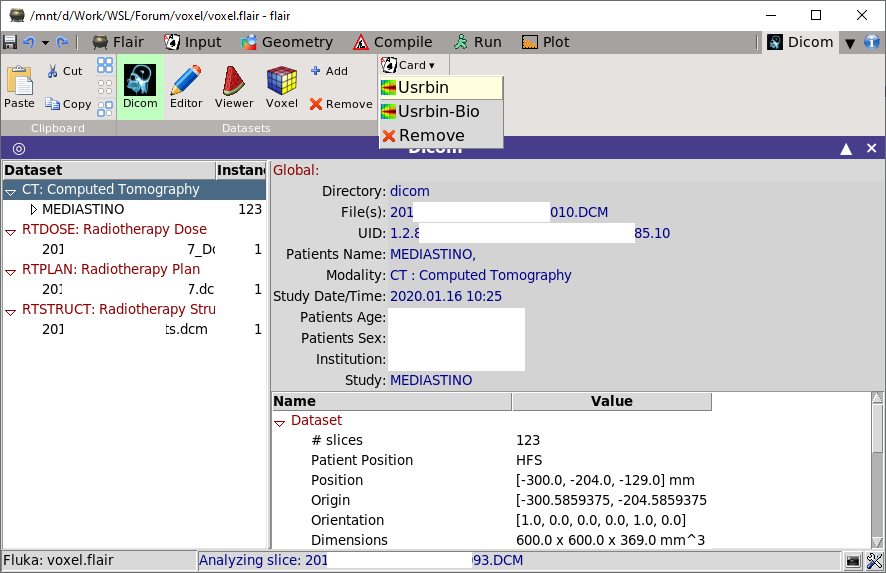
Copy the source.bnn created in the previous step to this project. Use the OPEN card to tell FLUKA to open it. Don’t use units below 20, the Status should be OLD . - can you please share a screenshot of this ? This "open card and status " is not very clear to me.
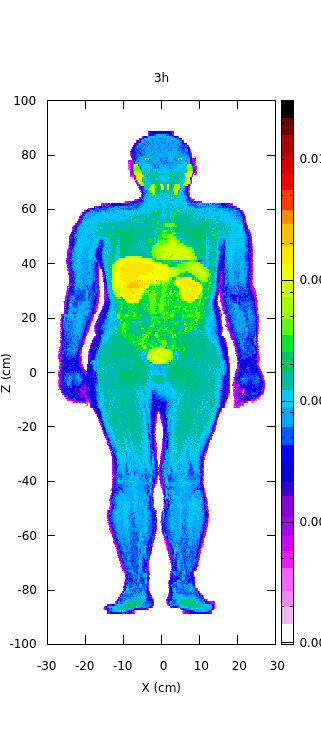
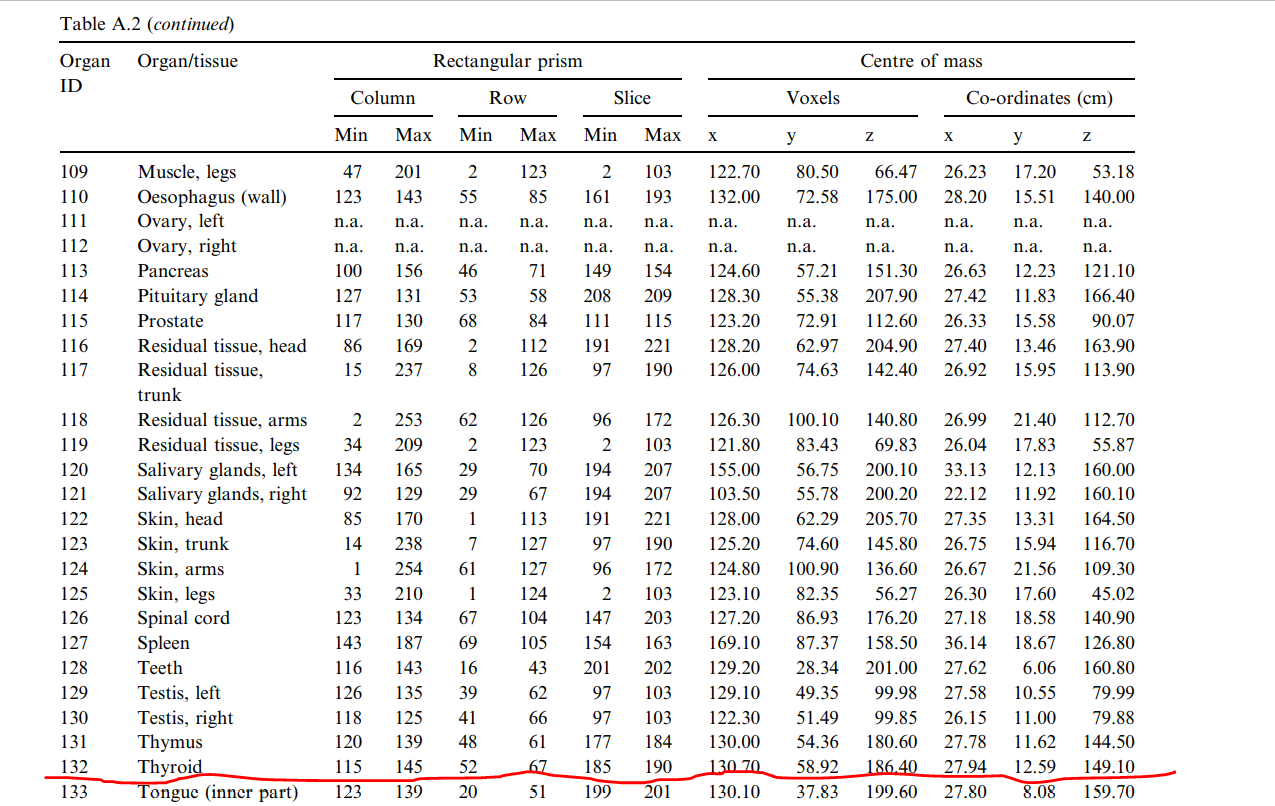
Apart from that, I guess this is for a dicom file. Can it be done for .vxl file also ? For example .vxl created from ICRP 110 data (please see the attached image where I have marked the thyroid position).
In that case, a volume source can also be created in source.f using the marked information (i.e. creating a uniform sampling through out an RPP with the help of the values given for min and max of row, column and slice and centre of mass )?
If I use source.f, then does the isotope source card still work ?
Yes, exactly that is the reason. The voxel regions converted from a CT dicom file do not match with the actual organs, so this trick is needed to be able to select the volume belonging to the ROI.
I added a screenshot to the instructions above.
I think, it is even simple with voxel geometries created manually, since (as far as I know) they have voxel regions based on the organs. Then, it is possible to change the material assignment of one voxel region with an ASSIGNMA card. Or if the material is unique to the organ, it can be used in the user routine.
Yes the volumetric source for Step 1 can be created in a source routine as well, but it is not necessary, the built in volumetric sources a completely adequate.
If I remember correctly the ISOTOPE source set in the input file will be used by the source routine as well, which would allow to use the other features of the source routine.
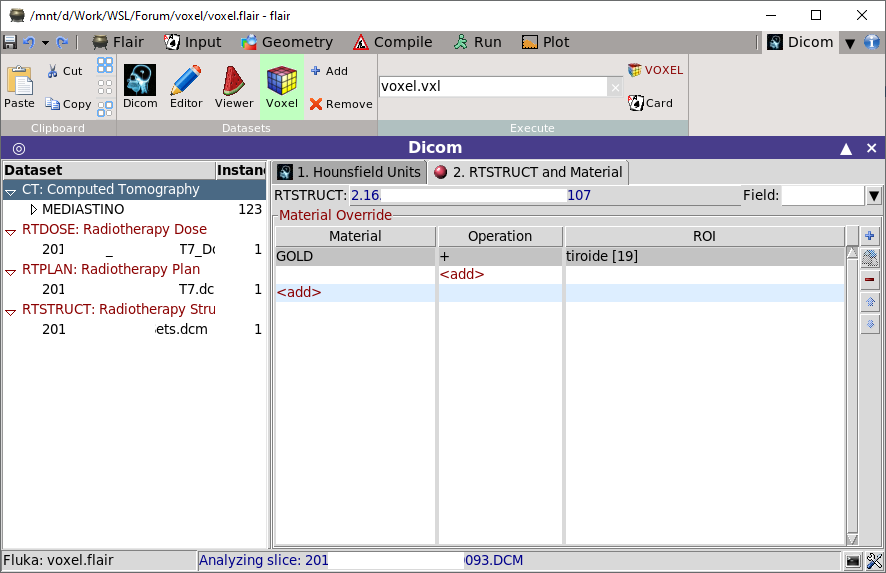
As you instructed, I tried to follow that in my voxel input file (please see the attched input, I have not added .vxl file, if needed I can send that to you). Please note voxel111 represents thyroid and I have changed its material as gold using ASSIGNMA card. In the volumetric source, I have used the information of max and min values for columns, rows and slices and I have multiplied those values with voxel resolution : in plane resolution = 0.2137 cm and slice thickness = 0.8 cm). Same information I have added in the USRBIN Cartesian binning.
I want to get one clarification regarding this: this RPP dimension is actually bigger than the thyroid dimension. But this won’t matter since the comscw.f ensures that only regions (voxels) having material gold will be counted. Am I right ?
Now, I have given 1E+6 runs with 10 spawns, 5 cycle. I am getting zero values in all the bins. Also, I have used your comscw.f. Can you please check if everything is properly added or not ? Will there be any change in comscw.f as I am using voxel instead of dicom ?
without the voxel file I can’t verify completely, but I have two observation:
Since the thyroid has it’s own material, it is not necessary to change it to gold, you can change the material name in comscw.f to match.
The definition of the CART-VOL source is incorrect. The (Xin, Yin, Zin) parameters create a hole inside the volume, where no primaries is generated, so these should be zeros. The (Xmax, Ymax, Zmax) values should be the length of each side of the box.
But this doesn’t have to be exact, since as you correctly mentioned, the user routine will take care of the location outside the thyroid. However a smaller box is better, since then less primary would be lost.
Another issue with the CART-VOL source is it’s location. It is centered around the position defined in the first BEAMPOS card. Since it is commented out in your input, then the source will be around the origin.
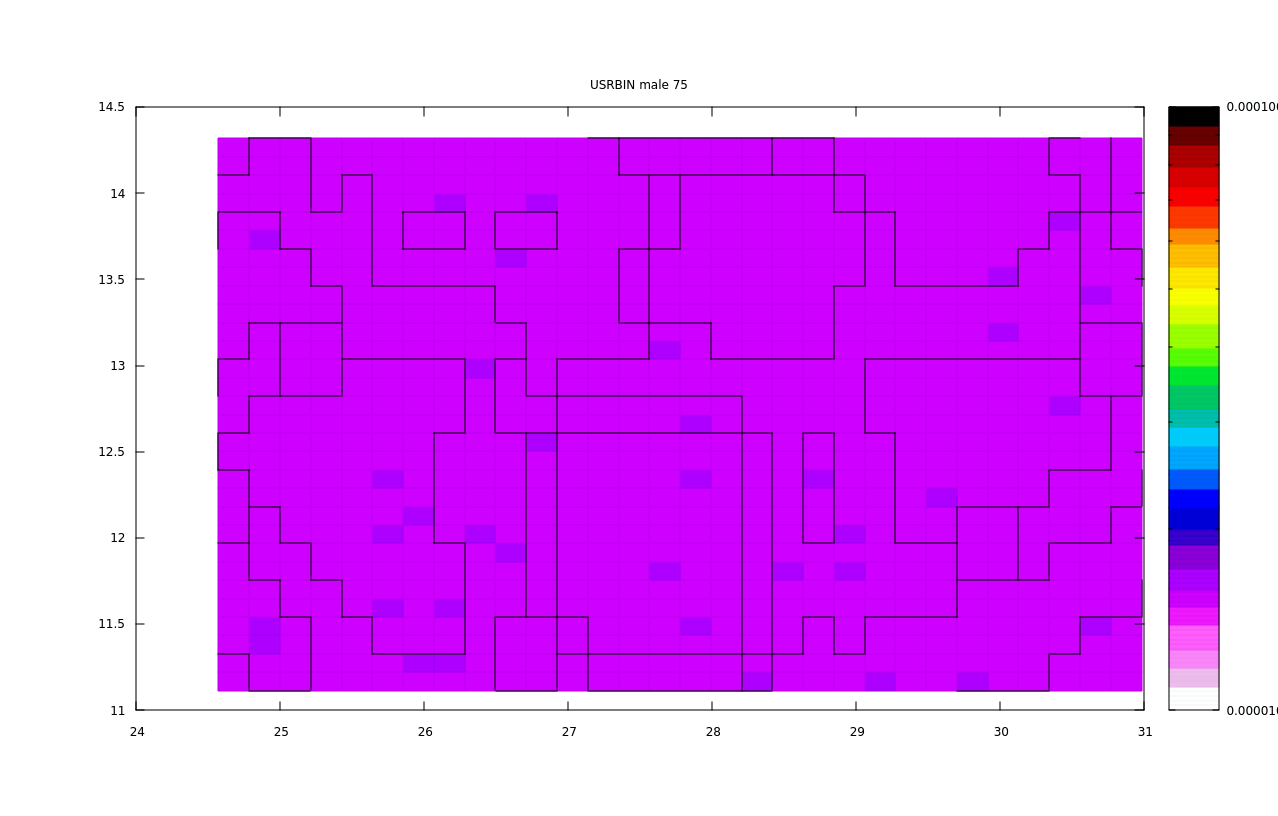
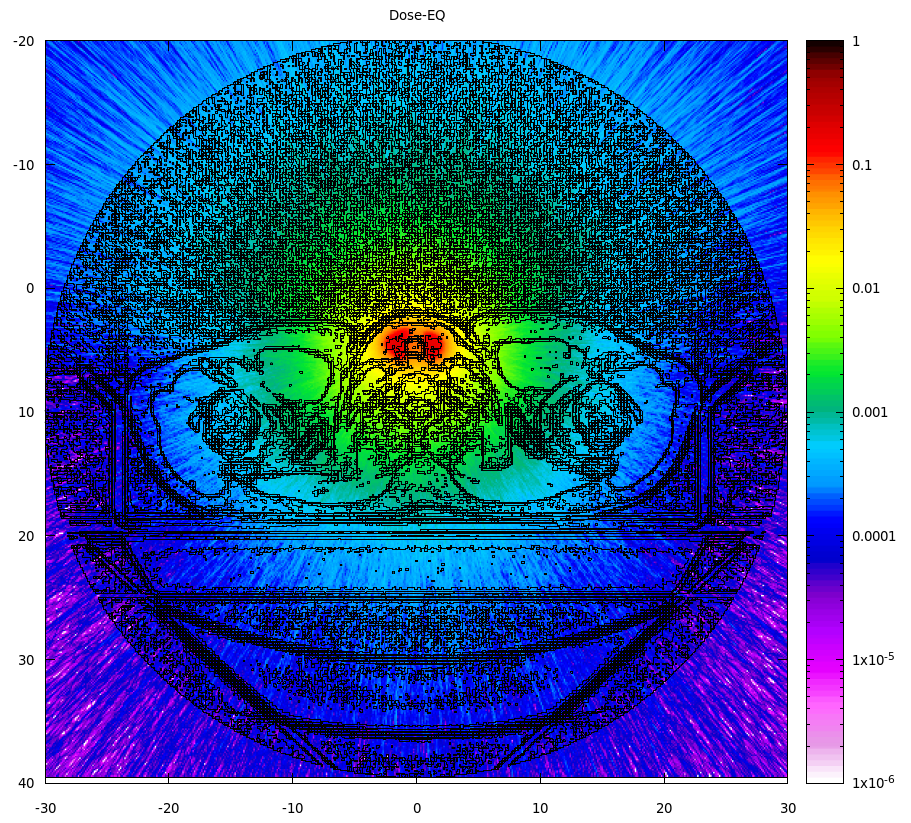
Thank you David for pointing out the issue. I hope I have modified them now. Right now I am unable to send you the .vxl file due to upload size limit. I have used gold, just to be extra sure that no other organ has the same composition as of thyroid I am attaching here the usrbin output and the plot for that. It is not same as yours though.
I have modified the CART-VOL. I guess the x, y, z limits in USRBIN are the usual boundaries of source RPP.
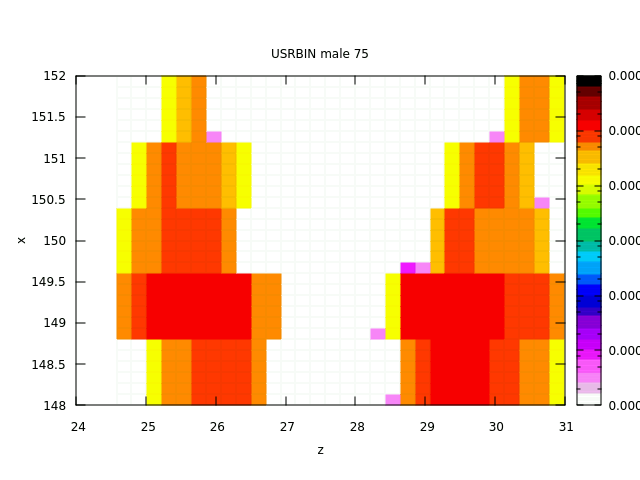
Please see the attached screenshot where I have added the card and I have also attached the usrbin output and plot. It looks like it is not uniform through out the region.
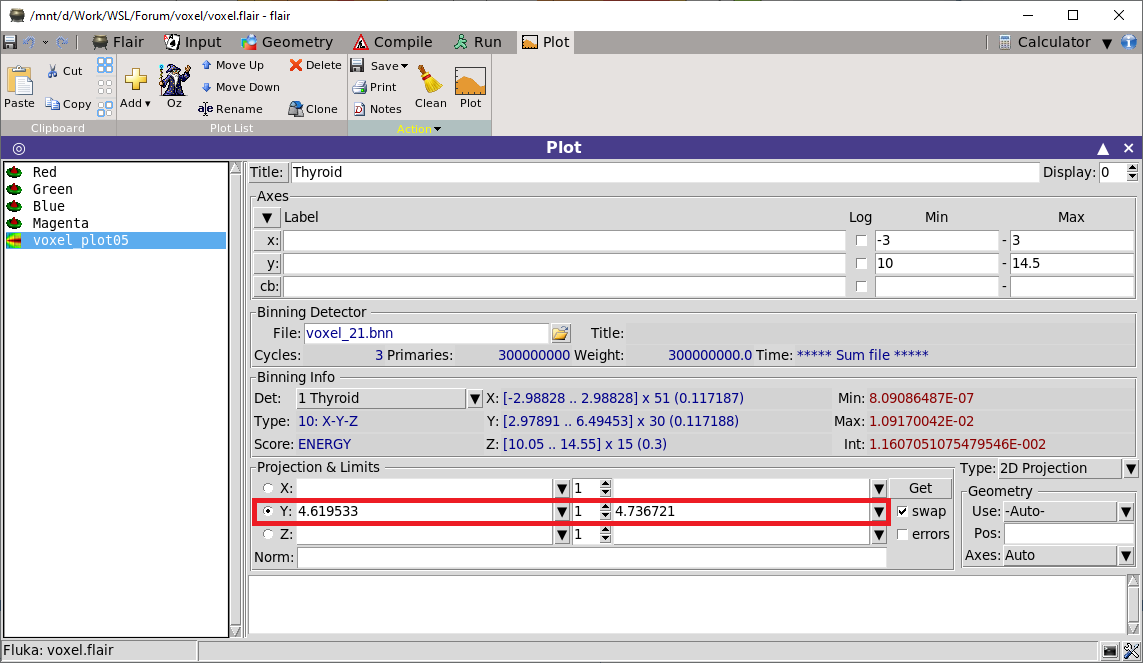
the standard plots (not the overlays in Geoviewer) show the average value across the third axis.
You need to select a layer with the dropdown lists next to the projection:
Hi,
The proposed method for defining a distributed source seems to be somewhat difficult and complex, especially if the number of source organs is large. However, just by writing a suitable source file, many organs of the voxel phantom can be easily defined as distributed sources.
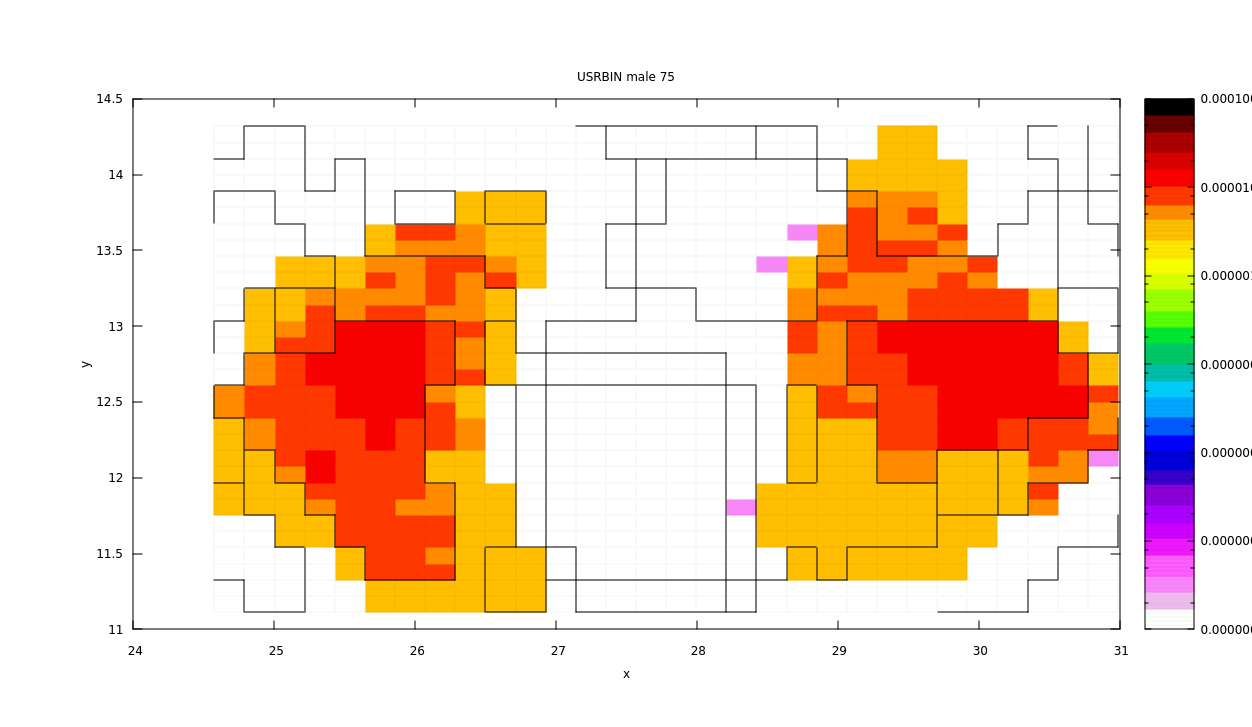
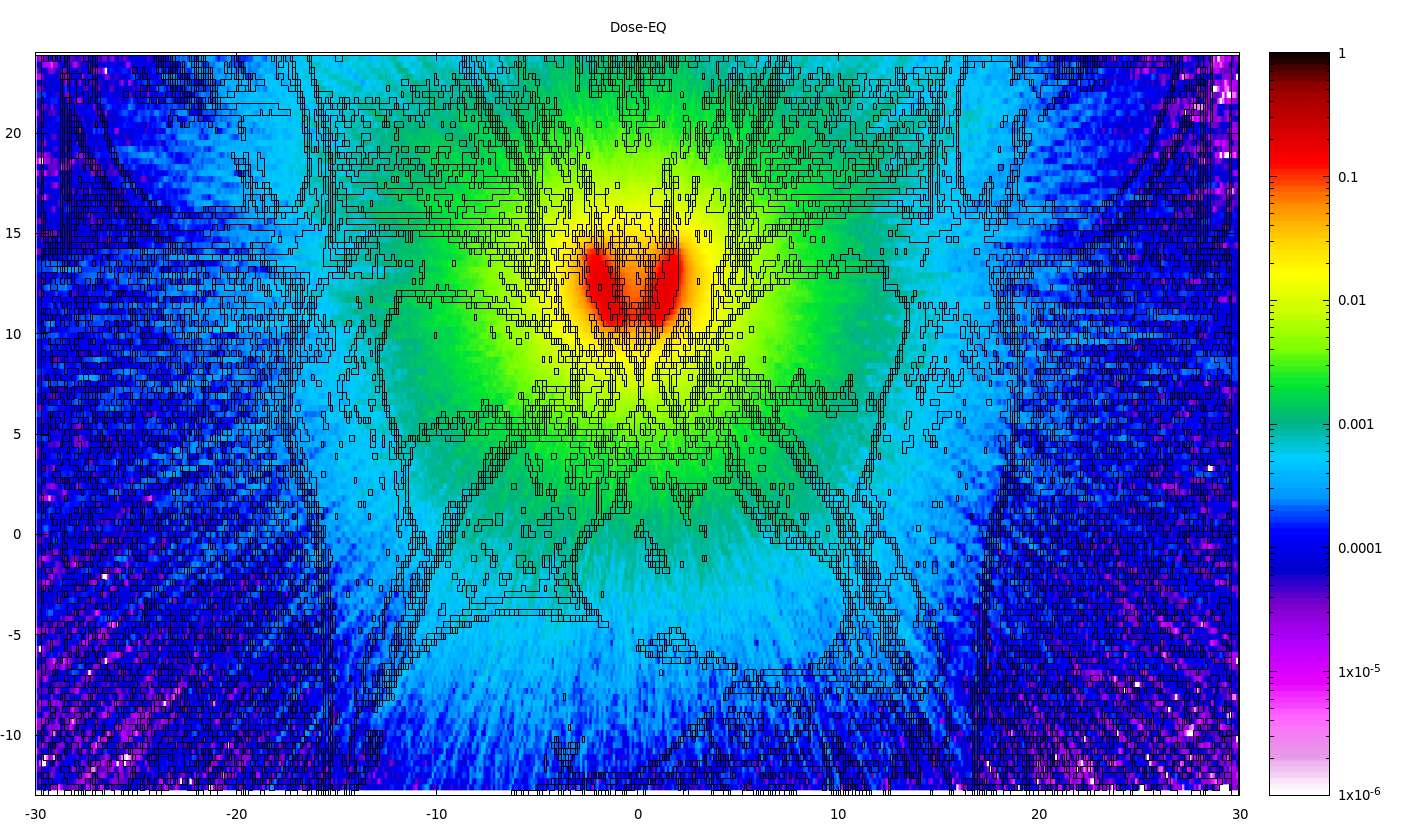
I tried to select a layer, still I am unable to get uniform energy deposition (please see the attached image).
Also, can you please explain what is meant by minimum and maximum project limit ? When we choose Y, it means XZ projection on a particular Y level. Then what do these project limits signify ?
By default the USRBIN plot in case of a Y projection averages all the values along the Y axis for a given X-Z coordinate. With the projection limits you can select the range where you want the values averaged and plotted. If you select a range of one bin, you get the actual values in the selected Y layer. The values in the drop-down menus are the exact coordinates of the bin boundaries.
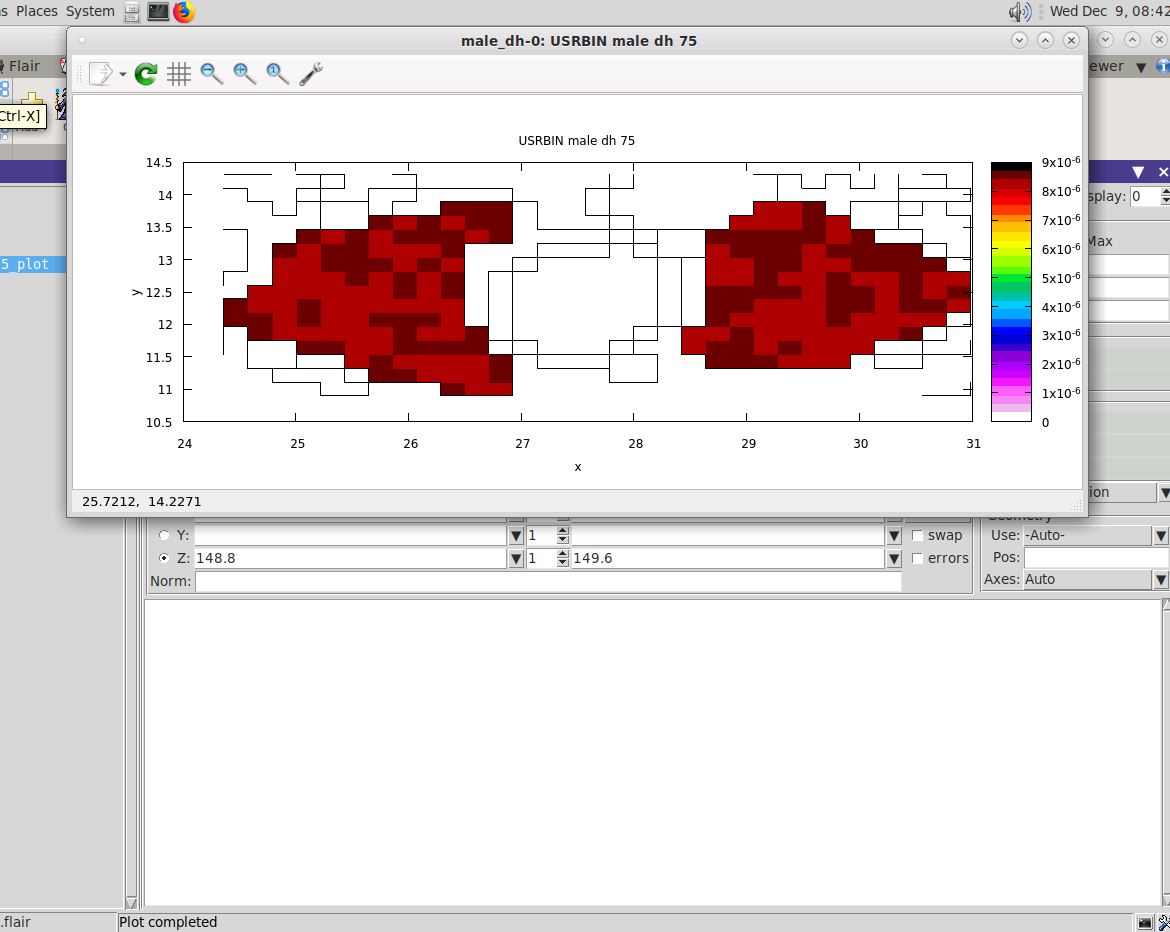
You can find an example plot here: male_dh.flair (26.5 KB)
I updated the USRBIN scoring and source as well, since some voxels of the thyroid were cut off.
Thank you David for the help. I am attaching the plot here that I got with your modified file.
Although it is in the red region, but it is not as uniform as your plot that you posted initially.
Can you please explain how you have selected those values in USRBIN scoring and source. Earlier what I did was: since in plane resolution = 0.2137 cm, slice thickness = 0.8 cm,
hence, the dimension of the rectangular prism will be
x1 = 115 x 0.2137 cm = 24.5755 cm, x2 = 145 x 0.2137 cm = 30.9865 cm [ since column (min) = 115, column (max) = 145 , according to the previous image that I posted]
similarly, I have calculated y1, y2, z1, z2.
Am I missing something ? It will be very helpful if you clarify this so that I don’t miss any voxel for any other organ in future.
in your plot, you are still selecting multiple Y layers, so what you see if the average of them.
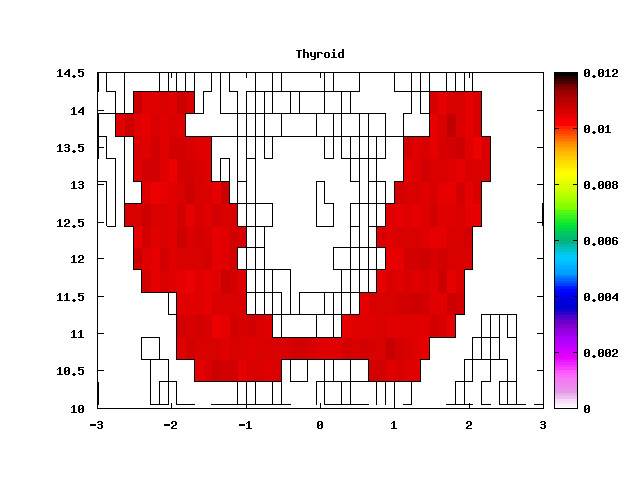
Try plotting between 12.822 and 13.0357. (Difference: 0.2137 = 1 bin)
I was verifying the USRBIN scoring visually in the Geometry tab. I used a custom overlay Scoring to show the scoring over the voxels. I was scanning along the axes, and I saw some voxels with GOLD material outside the scoring.
If you calculated the values based on the table from the ICRP publication, then I would assume that the table has incorrect values, or the rectangular prism has a special meaning in this case.
Thank you David. I have plotted it between one bin now. Can we ignore the thin band of lower energy (purple one) ?
Also, I will try to understand the values given in ICRP 110. It came to my mind that while creating .vxl file using the fluka program from the .dat file provided by ICRP, there is something called old and new voxel id and they are printed in one file. So, may be I have to see the equivalent new voxel number there. I will explore this.
The energy deposition in the purple areas maybe caused by rounding imprecisions around the bin edges. Since their values are multiple orders of magnitude less than the majority of bins, they probably only cause a negligible error. If you plot with a linear color bar they should disappear.
Thank you David for your help and time. I learnt many things. This is how it is looking with linear color bar. The slight variation in red color may be due to the statistical error associated with each energy.
Thank you for your reply. I’ll try to do everything that you mentioned. I have one more question about distributed source. If I use ‘source.f’ file and describe the distributed source as a number of point isotropic sources with coordinates matched with thyroid, will it be a proper approximation? Say, I’ll describe 100 point sources by using FLKRNDM(XXX) and IF ELSE statement?
I would say, it depends on, what you want to score. The further away you go from the thyroid, the better the approximation gets. In any case I would do a small comparison simulation for bot cases to see.
Before you code the ~ 100 points in the source routine, you may want to look at the SPECSOUR card with the BEAMSPOT option, or the new source_newgen.f source routine’s “phase space” section.

 I am attaching here the usrbin output and the plot for that. It is not same as yours though.