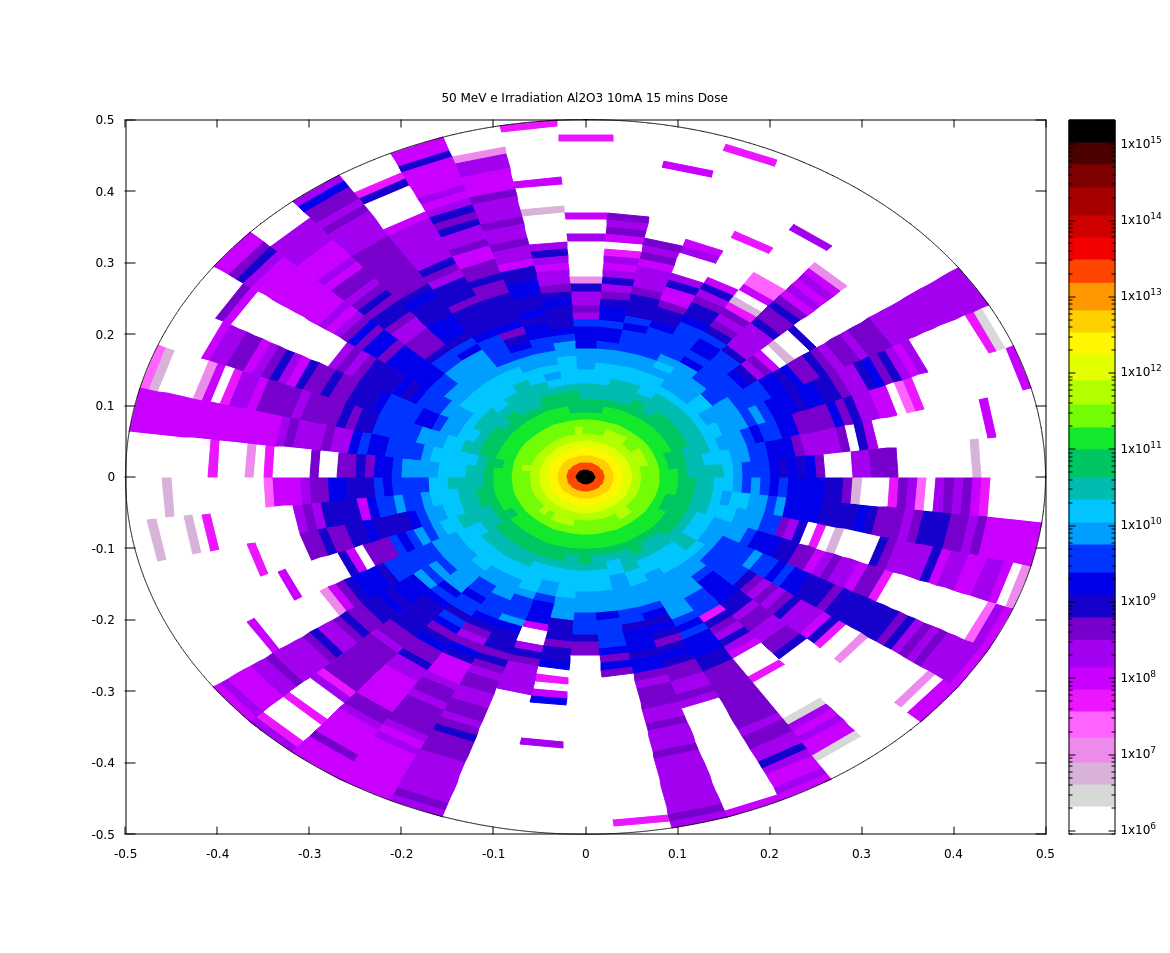
I am attempting to simulate the dose as received by my Al2O3 disk due to an incident electron beam. I have normalized the results to my specific number of electrons. I understand that the unit of dosage used in FLUKA is in pSv. My result however seems to be much larger than anticipated. The normalization I used is 5e11 * 60 * 15, so 15 minutes at 5e11 electrons/s. Could an expert please validate the results obtained.
You sent a(n unphysical) pencil beam, with no transverse size, which by definition produces an infinite dose on the beam axis.
Note also that absorbed DOSE [GeV/g = 1.6e-7 Gy] and DOSE-EQuivalent [pSv] are different quantities.
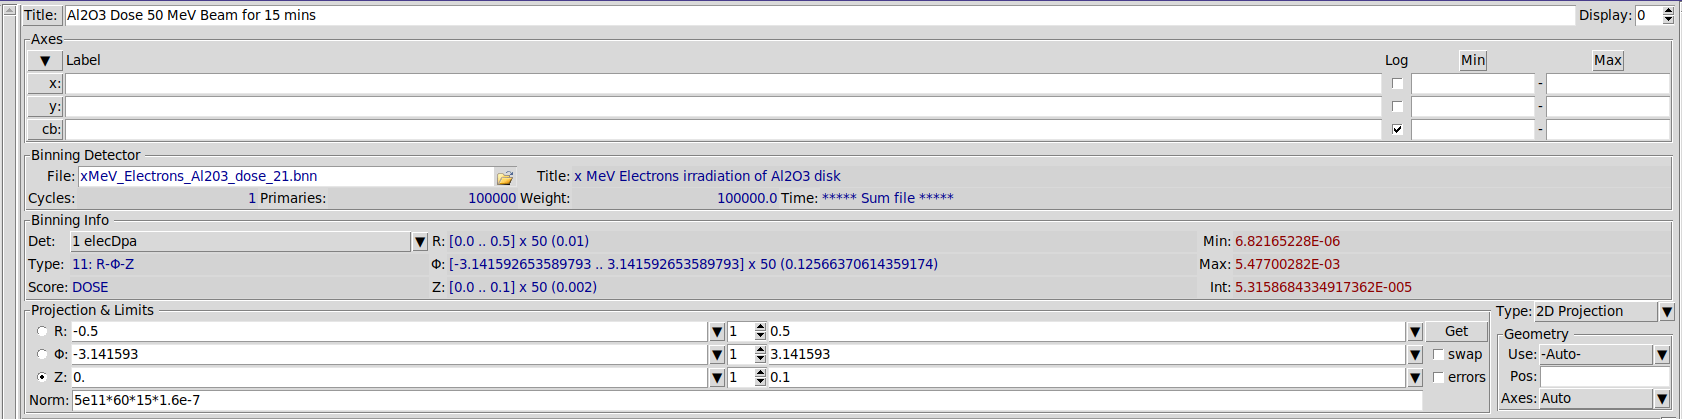
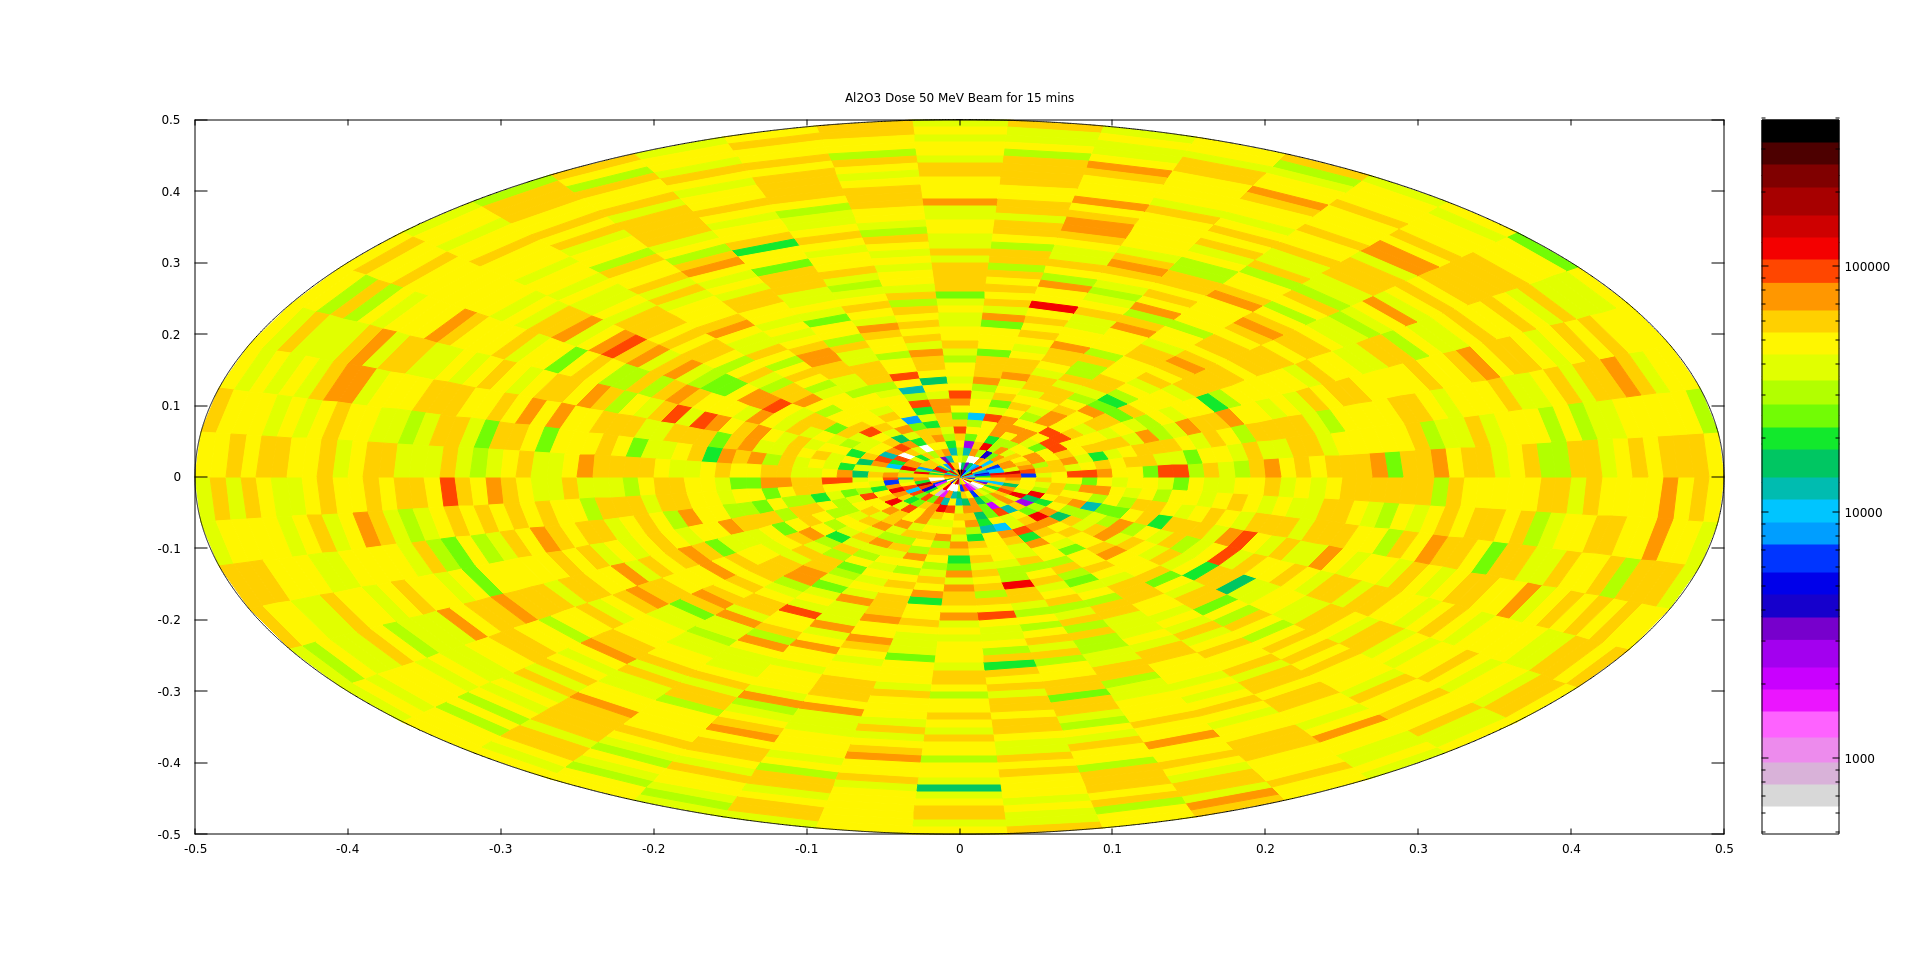
Hi thank you for the insight I changed the beam size to 15mm x 15mm. I also changed the USRBIN part to dose as I am looking to simulate Gy. I also attached a screen shot of the plotting window I added the 1.6e-7 Gy which you mentioned. This is for a total of 5e11 electrons/s for 15 mins with the conversion you noted is this now accurate?
I appreciate the feedback you have provided me with.
For a 15 mm wide beam, a 0.1 mm radial resolution is not justified (it’s excessively fine) and induces the dose fluctuations you observe (to smooth them over you would need more statistics, or a coarser resolution, which is still physically consistent with the beam size).
For the 2D plot (you can correct the aspect ratio by clicking on Title), you do not need to specify the R and phi ranges (by the way, the R range starts from zero, being negative radii meaningless). On the other hand, the choice of the Z range is not innocent: you select there the thickness over which the dose value is averaged.
I will use more statistics once the input and norm is finalized. In what way should I adjust the aspect ratio? In the norm field have I done what I set out to do by converting to Gy? Lastly would I not average over 0 to 0.1 since that is the thickness of my sample?
In this case I’d say yes (but then why are you asking for 50 bins along z?), but in general, if the dose is not constant along z (and physically rises - like for a hadron Bragg peak - or decreases), you may want to take the picture at a specific z-depth to identify the maximum dose, and not average over an extended length and miss the latter.
Talking about the input, PHYSICS/EVAPORAT and IONTRANS are irrelevant here (since nuclear reactions have no role), the second PART-THRes was likely meant for NEUTRONs (which anyway are not generated, while it makes no sense for ELECTRONs), and the USRTRACK for ENERGY has little sense (while USRTRACK for PHOTONs gives you the photon fluence spectrum in the region).
Thank you @ceruttif should I remove the second PART-THRes all together then as well as the USRTRACK for ENERGY? Other than that I think it has been solved.
One final thing @ceruttif if you could when you have the chance see the previous post in which you helped me:
The question applies to both this post and that one. You mentioned the USRTRACK for PHOTONs, should this be changed to electrons for the purpose of my simulations?
I really appreciate all your help. You are an excellent moderator!
The presence/absence of USRTRACK has no effect on the physics simulation. It’s just a scoring card, providing you with a specific piece of info upon request. Said so, I agree that in your case, in addition to the dose evaluation by USRBIN, getting the electron spectrum may be of some interest, not inferior with respect to the spectrum of secondary (bremsstrahlung) photons. In this regard, you can obtain both, with no need to change the current card, rather adding another one.
Also, do not neglect the interesting information printed in the standard (verbose) output file (001.out).