Dear FLUKA experts,
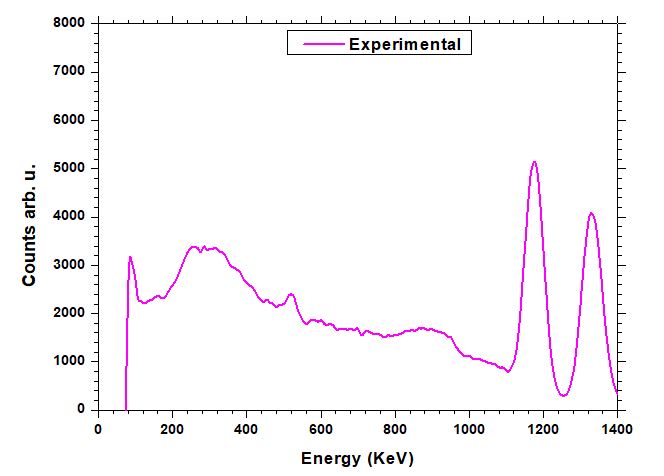
I have simulated a 2’‘x2’’ CsI(Tl) detector and obtained a spectrum for 60Co source. for guassian broading I used the usreou.f routine provided by David. The results of the detect card were normalized by the activity of the source. The source was created on 1st Jan 2005, so today its activity is about 16959. After this when I compared the FLUKA results with the experimental results I found a big difference. I have attached the results of both FLUKA and experimental and also the input file. Why the results obtained using FLUKA are very lower than the experimental results?
Naii.inp (2.1 KB)
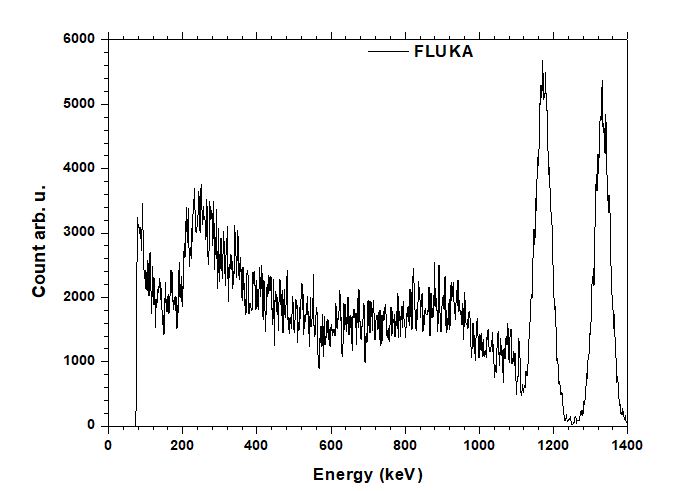
I’m sorry, where do you see a big difference? It seems to me that given the statistical uncertainty of your simulations (which you didn’t plot but one could guess given the fluctuation of the spectrum) the results are in pretty good agreement.
Dear Abdul,
just to note, Gaussian broadening now can be applied with the DETGEB card (7.22.15. DETGEB — FLUKA Manual), without the use of a user routine.
Cheers,
David
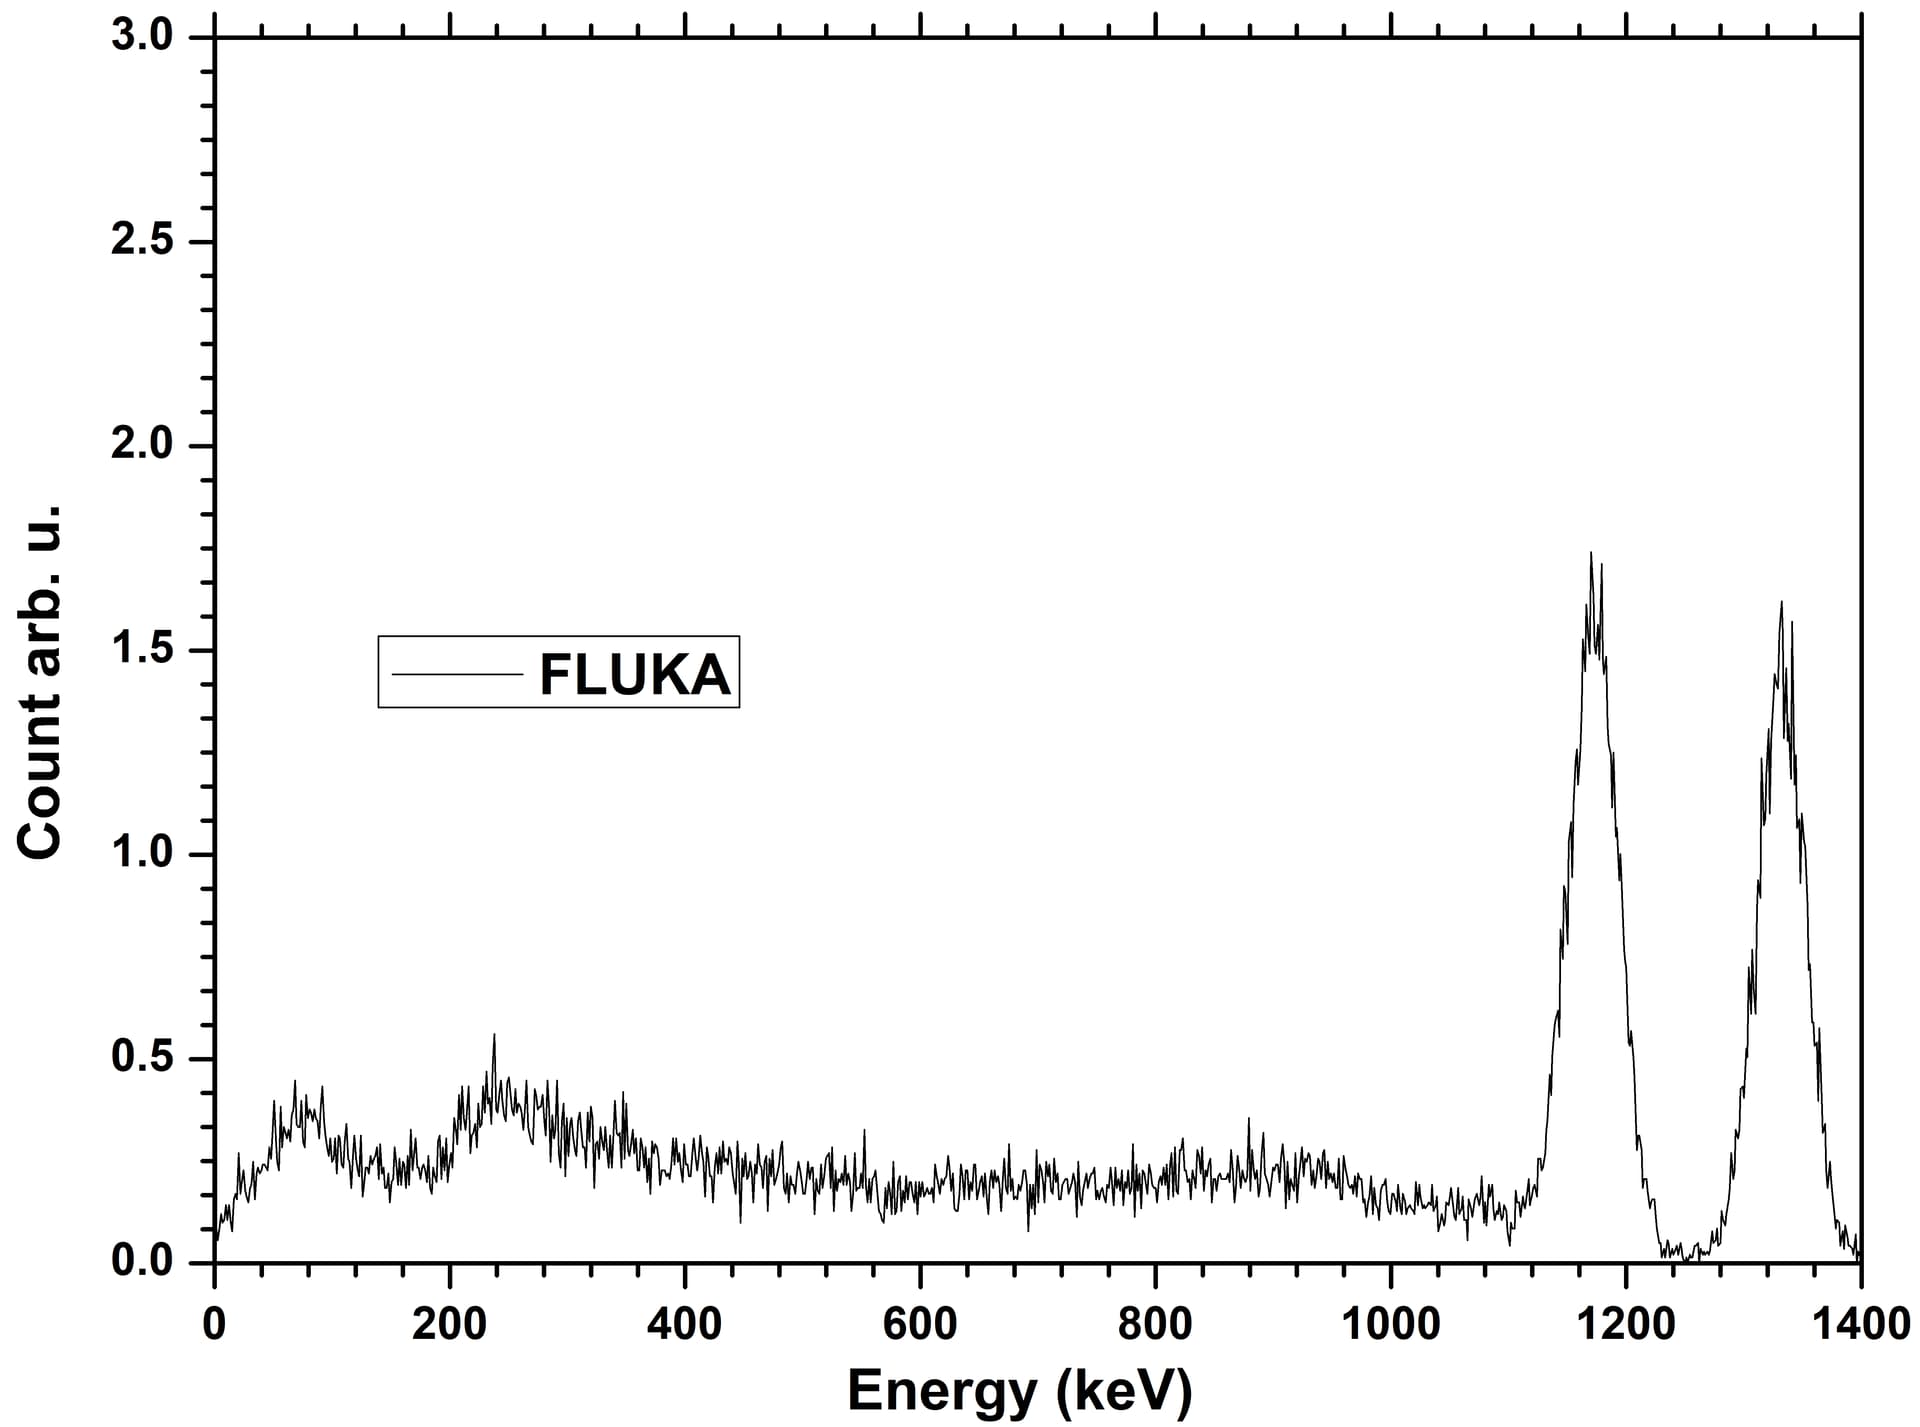
Thank you David and Amario for your kind response. But there was a mistake in the graph that contains the spectrum of FLUKA. Actually I used the 60CO source with 1uCi activity on 1 Jun 2005. So now the activity is 0.096uCi or 3552 Bq. Now when I multiply the results of DETECT card I got a specrum like the shown in figure where the counts are no more than 2 whereas in the experimental graph the counts are upto 5000. Secondly the
The experimental spectrum says ‘arbitrary units’, which by definition does not allow for a quantitative comparison. Over which time interval were those counts measured? Are the experimental counts divided by the energy resolution? When plotting a spectrum, the number of counts in an energy bin must be divided by the bin width (otherwise it arbitrarily scales with the latter).
FLUKA results, when multiplied by the source activity (Bq), shall be intended as count rates (per second) over the energy bin resulting from your DETECT card resolution (i.e., 1.6 MeV divided by 1024 channels = 1.56 keV).
In short, you should compare the two spectra after expressing both of them in counts/(s keV).
1 Like