and successfully simulated it using flair and the mainfludag executable.
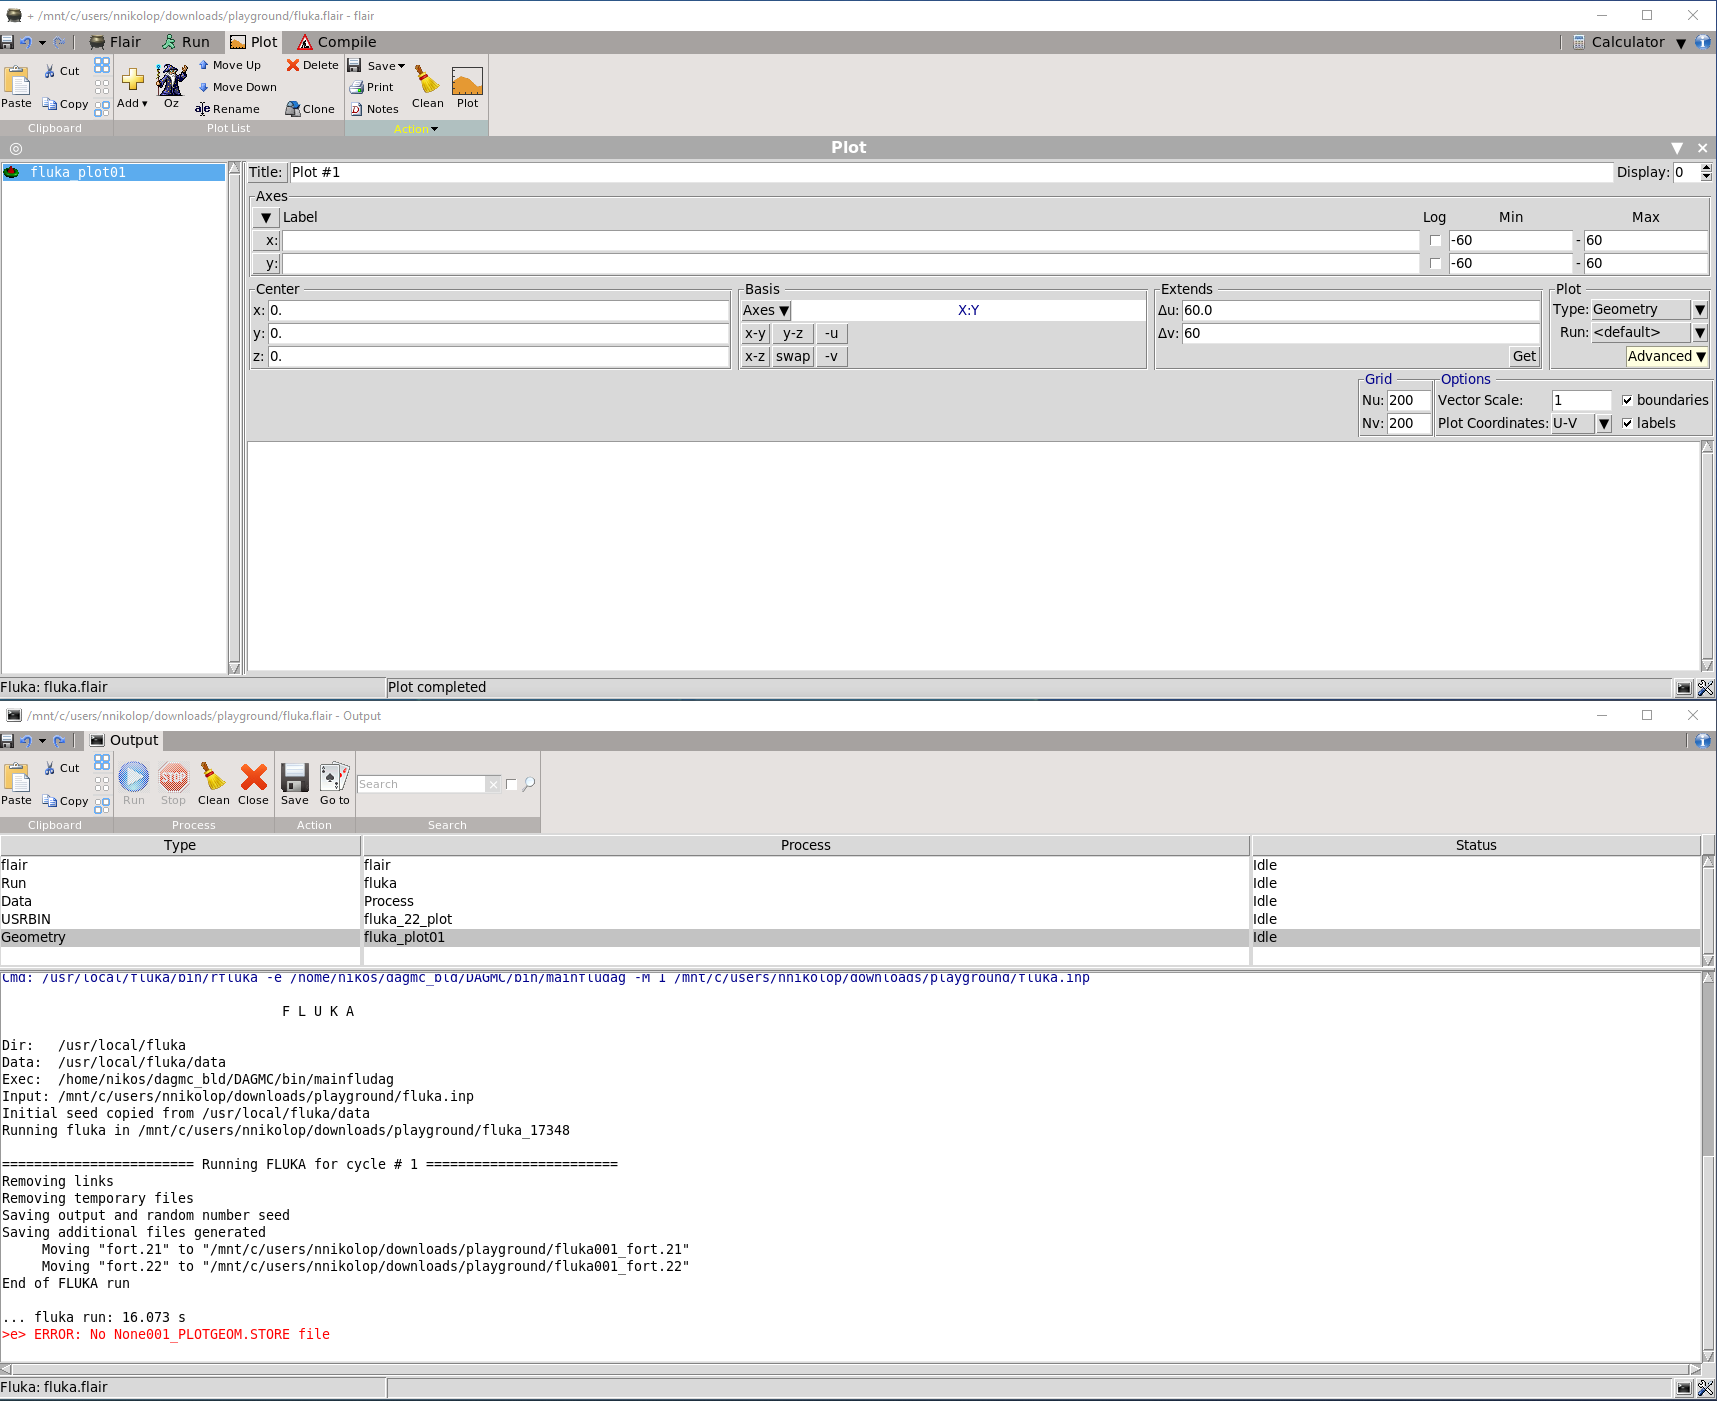
The problem is that I am unable to plot the geometry using the plot panel of flair (Gnuplot). I have selected intervals such that the predefined geometry is enclosed by the plotted area.
In my understanding after hitting the plot button a temporary input file is produced along with a PLOTGEOM.STORE file which is converted to a gnuplot readable file (with a .dat extension if I am not mistaken).
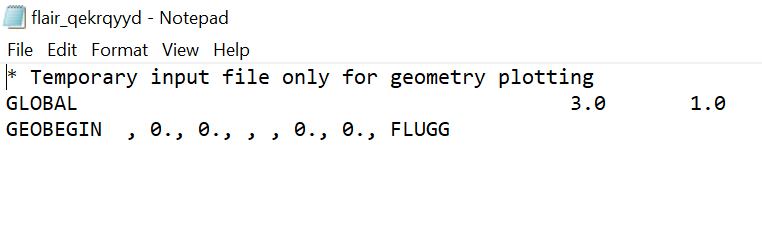
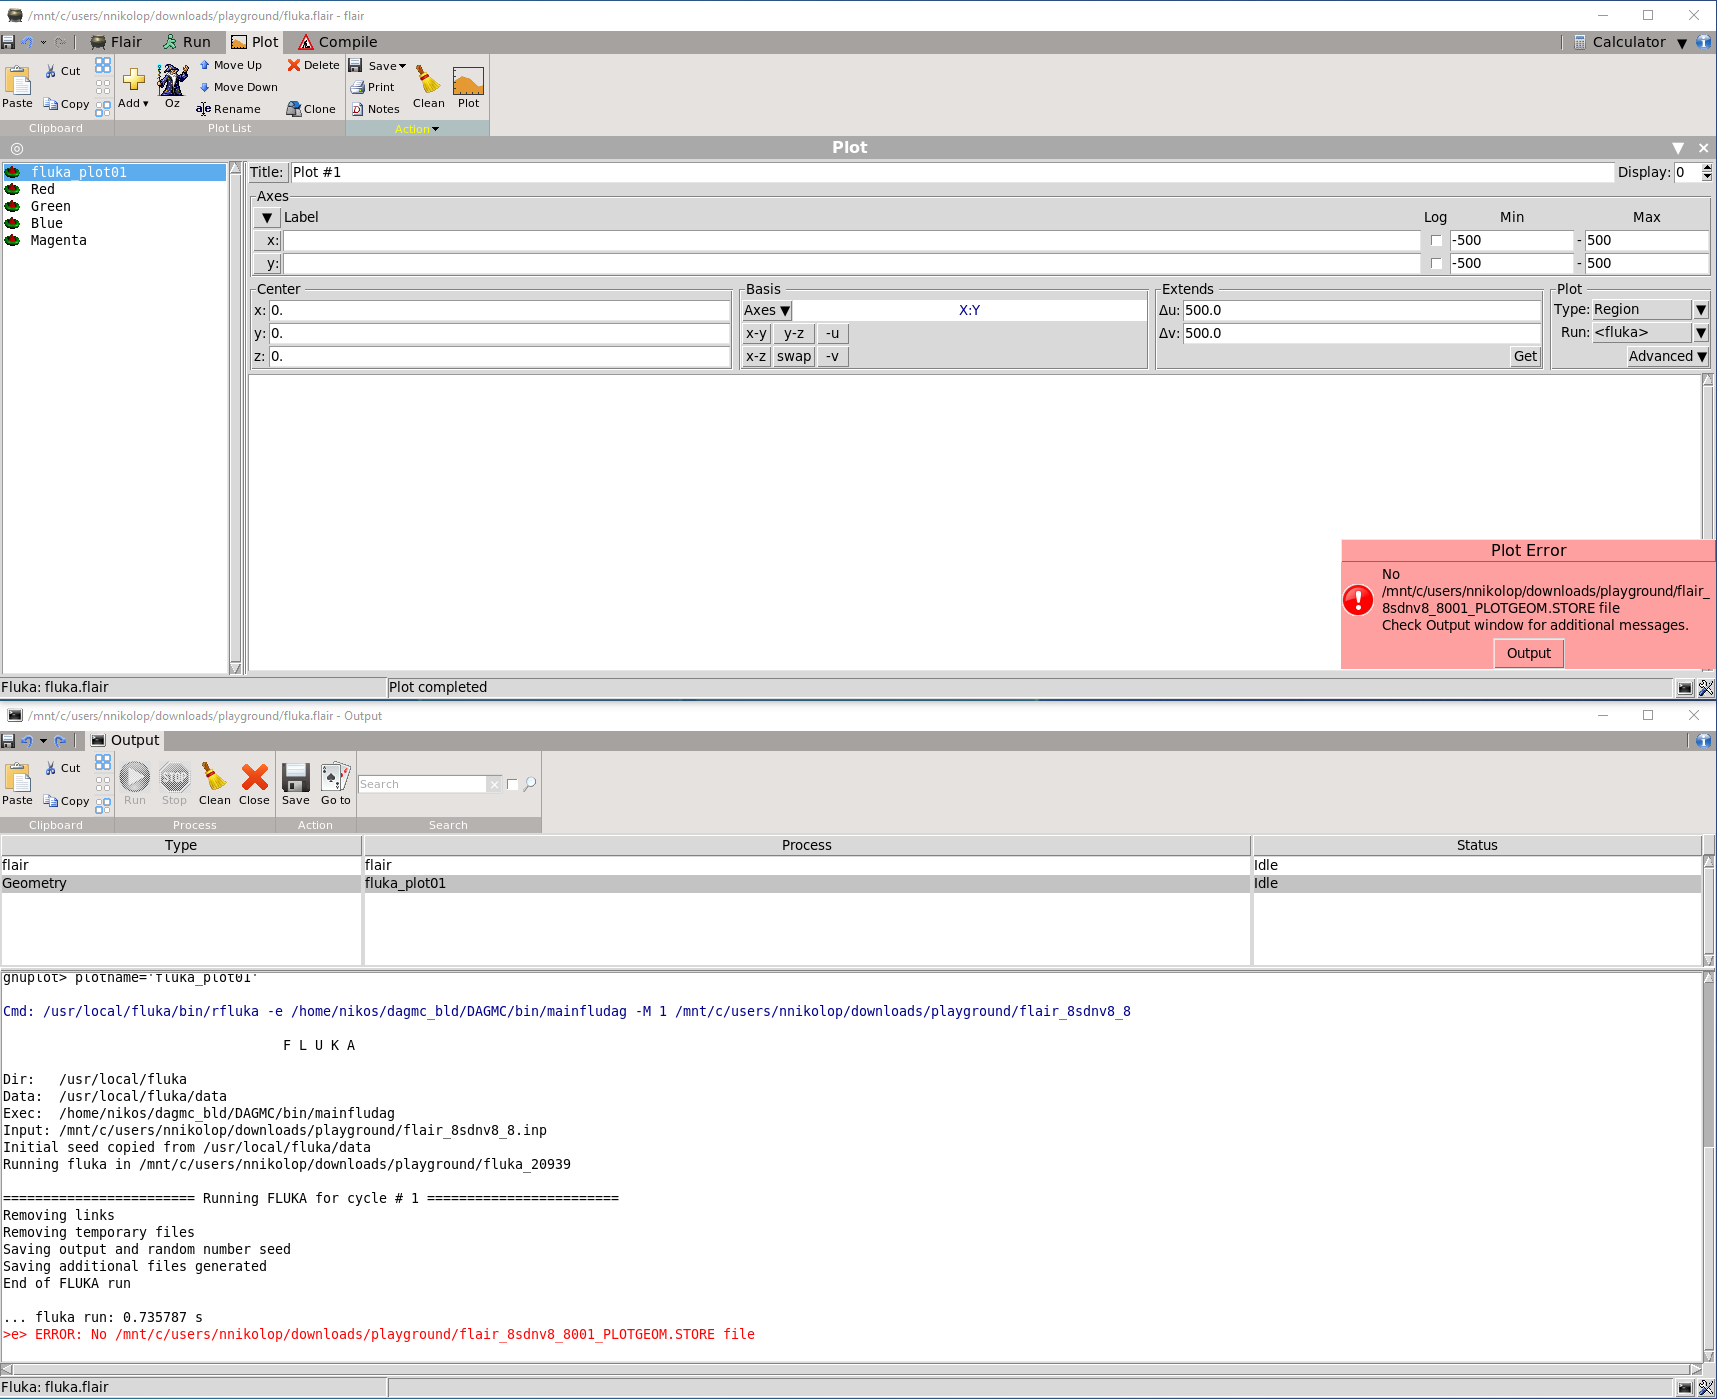
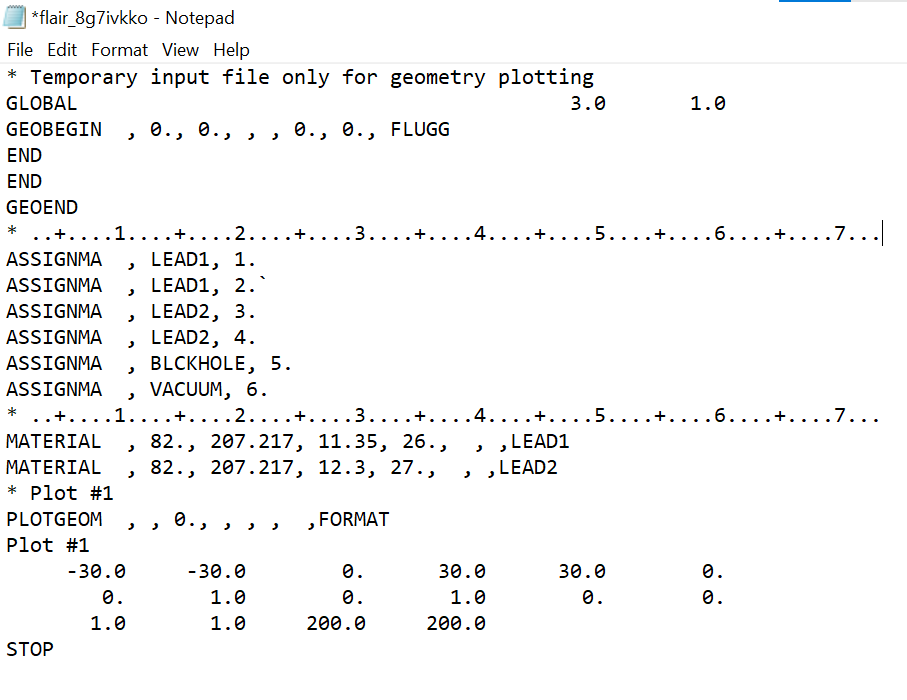
Even though a PLOTGEOM.store file is produced in my case thanks to the PLOTGEO card I defined in the input file, hitting the plot button produces the error depicted in the attached screenshot. After inspecting the temporary input files produced by flair they seem to be incomplete (second screenshot attached), which is strange.
I am also attaching to this post all files I used for this simulation (i.e. .flair, .inp, .h5m) as well as the files produced after attempting to plot the geometry. Any suggestions on how to plot my geometry using gnuplot are more than welcome.
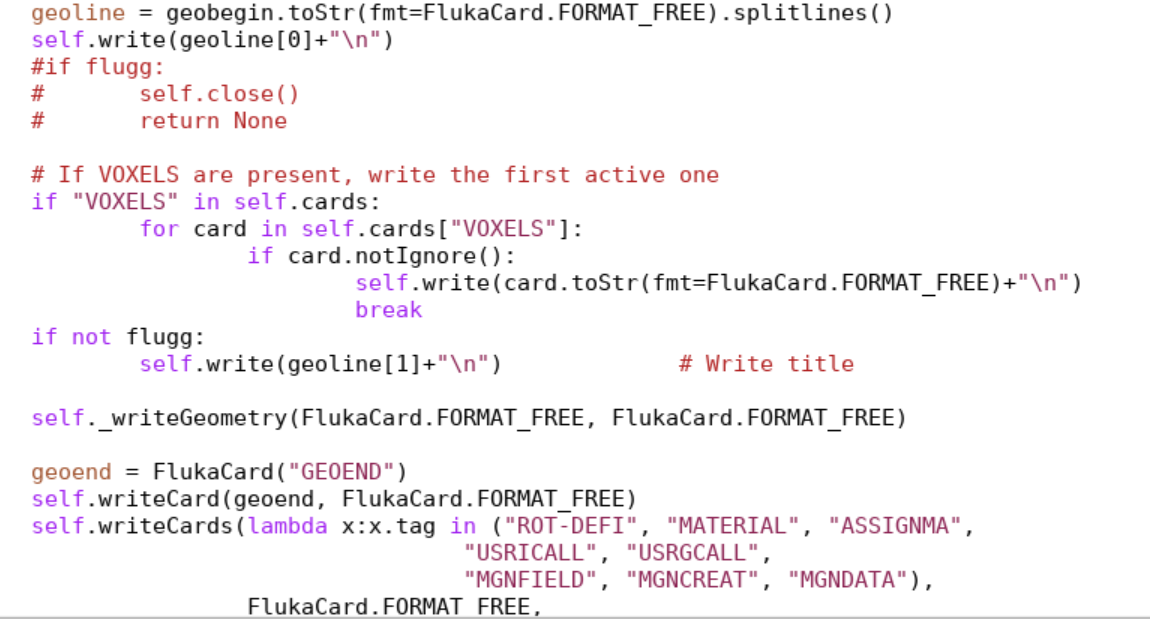
Hi @nnikolop you need to apply a small patch/correction to Flair, in fluka/input.py
Starting with line 2576, comment out the if flugg line and add the if not flugg line
		self.write(geoline[0]+"\n")
#               if flugg:
#                       self.close()
#                       return None

	        # If VOXELS are present, write the first active one
	        if "VOXELS" in self.cards:
                        for card in self.cards["VOXELS"]:
				if card.notIgnore():
	                                self.write(card.toStr(fmt=FlukaCard.FORMAT_FREE)+\
"\n")
	                                break

		if not flugg:
		        self.write(geoline[1]+"\n")             # Write title