Dear expert
In my paper, the editor asked me to explain if statistical uncertainty affecting the results?(which is the statistical uncertainty affecting the results?),and ask me to quantify “high precision” of FLKUA.
To answer this question, I need to know how fluka calculates the statistical error, but I didn’t find the relevant content in the manual,I found this problem in the Forum——Statistical error ,
This formula seems to only calculate the variance,can variance explain uncertainty and statistical error?There is some confusion in the format of your answer to this question. Take for example ,what’s mean of “ {\left\langle x \right\rangle} ”?
Looking forward to your reply, thank you
Dear @gao_han ,
Your thread contains several questions. Some of these regards basics statistics concept which are well beyond the scope of this forum. For these, I refer to a course of statistics or your supervisor.
For what concern the core question the editor asked you (what is the statistical uncertainty of your results), the answer depends on the estimators you have used.
For USRBIN, you would need to convert the .bnn file in ascii format to find the numerical value, otherwise you can in the flair plot tab ask to plot the uncertainty (thick the Error box) and get a plot of the uncertainty.
For USRBDX, the uncertainty is given in the _tab.lis file and _sum.lis file, otherwise you get an idea doing the relative plots with error bars.
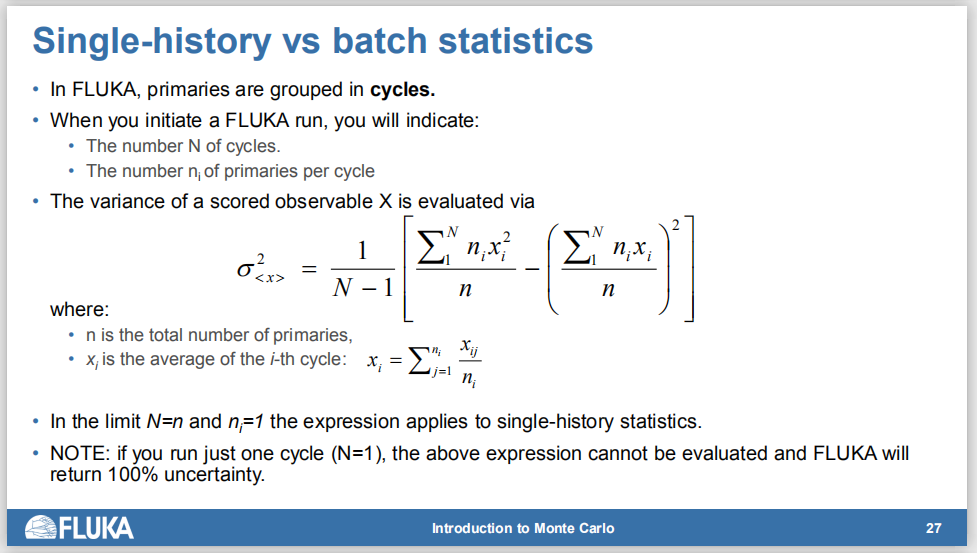
As pointed out in the discussion you refer to, the square root of the variance is the statistical error calculated by FLUKA.
<x>, i.e. the mean estimate representing the FLUKA result, whose statistical error is as above (namely the square root of the variance).
(The past answer featured the use of LaTeX expressions).