Dear FLUKA users and experts!
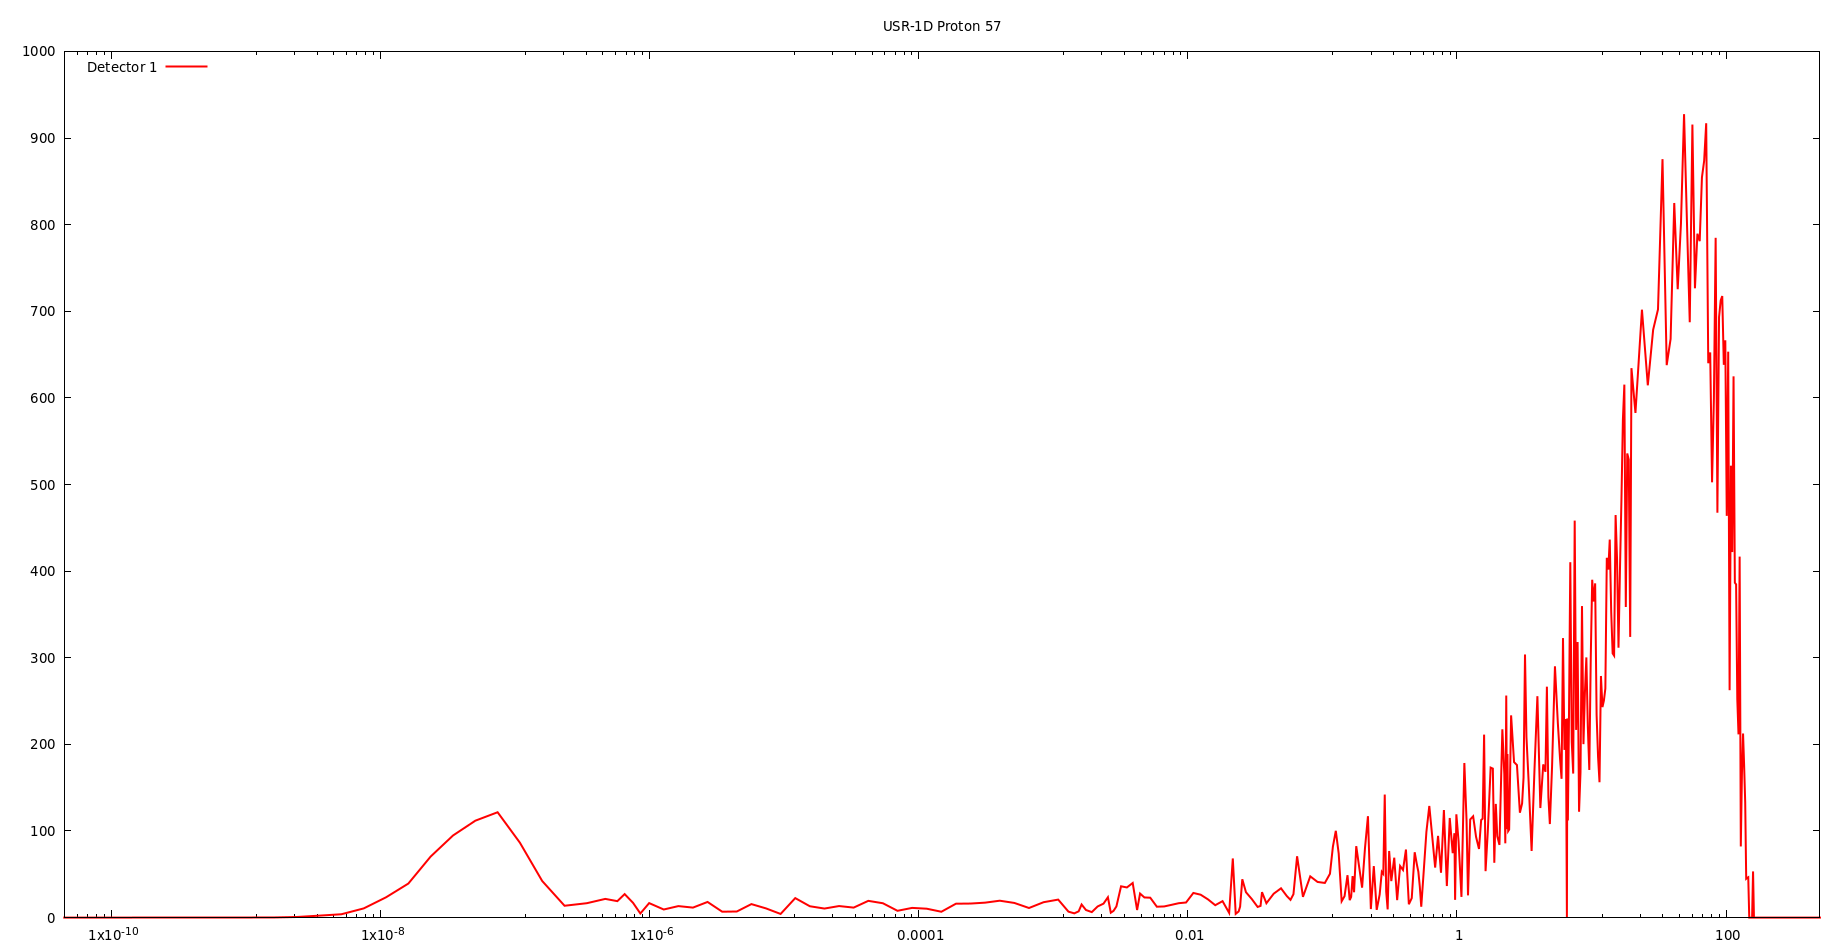
I use USRTRACK to record Neutron Fluence. After drawing with plot, I find that the tab.lis data generated by USRTRACK is different from the data displayed in the graph. What is the reason for this.Such as(
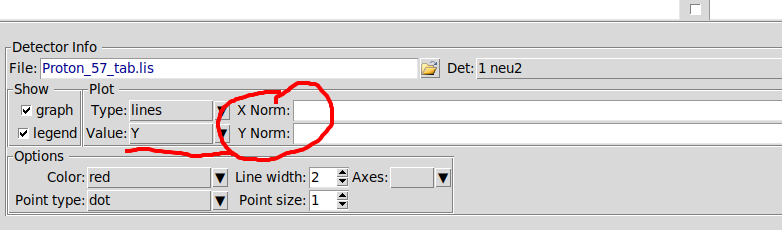
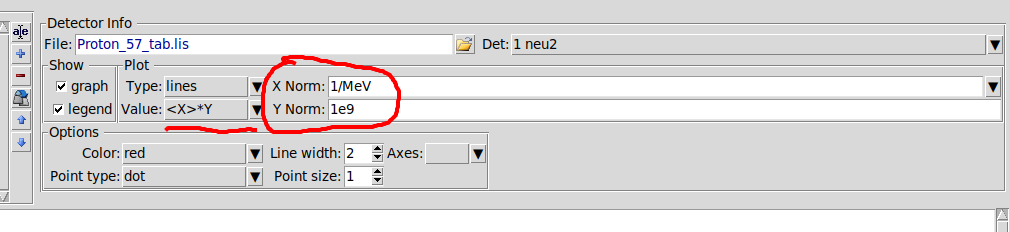
Why do you believe that the data displayed in the graph is different? Everything is looking consistent for me, just pay attention, that you are using <X>*Y for your Y axis and check other options in Flair before drawing. If you will draw this plot without these settings, you will display exactly the data from your file.
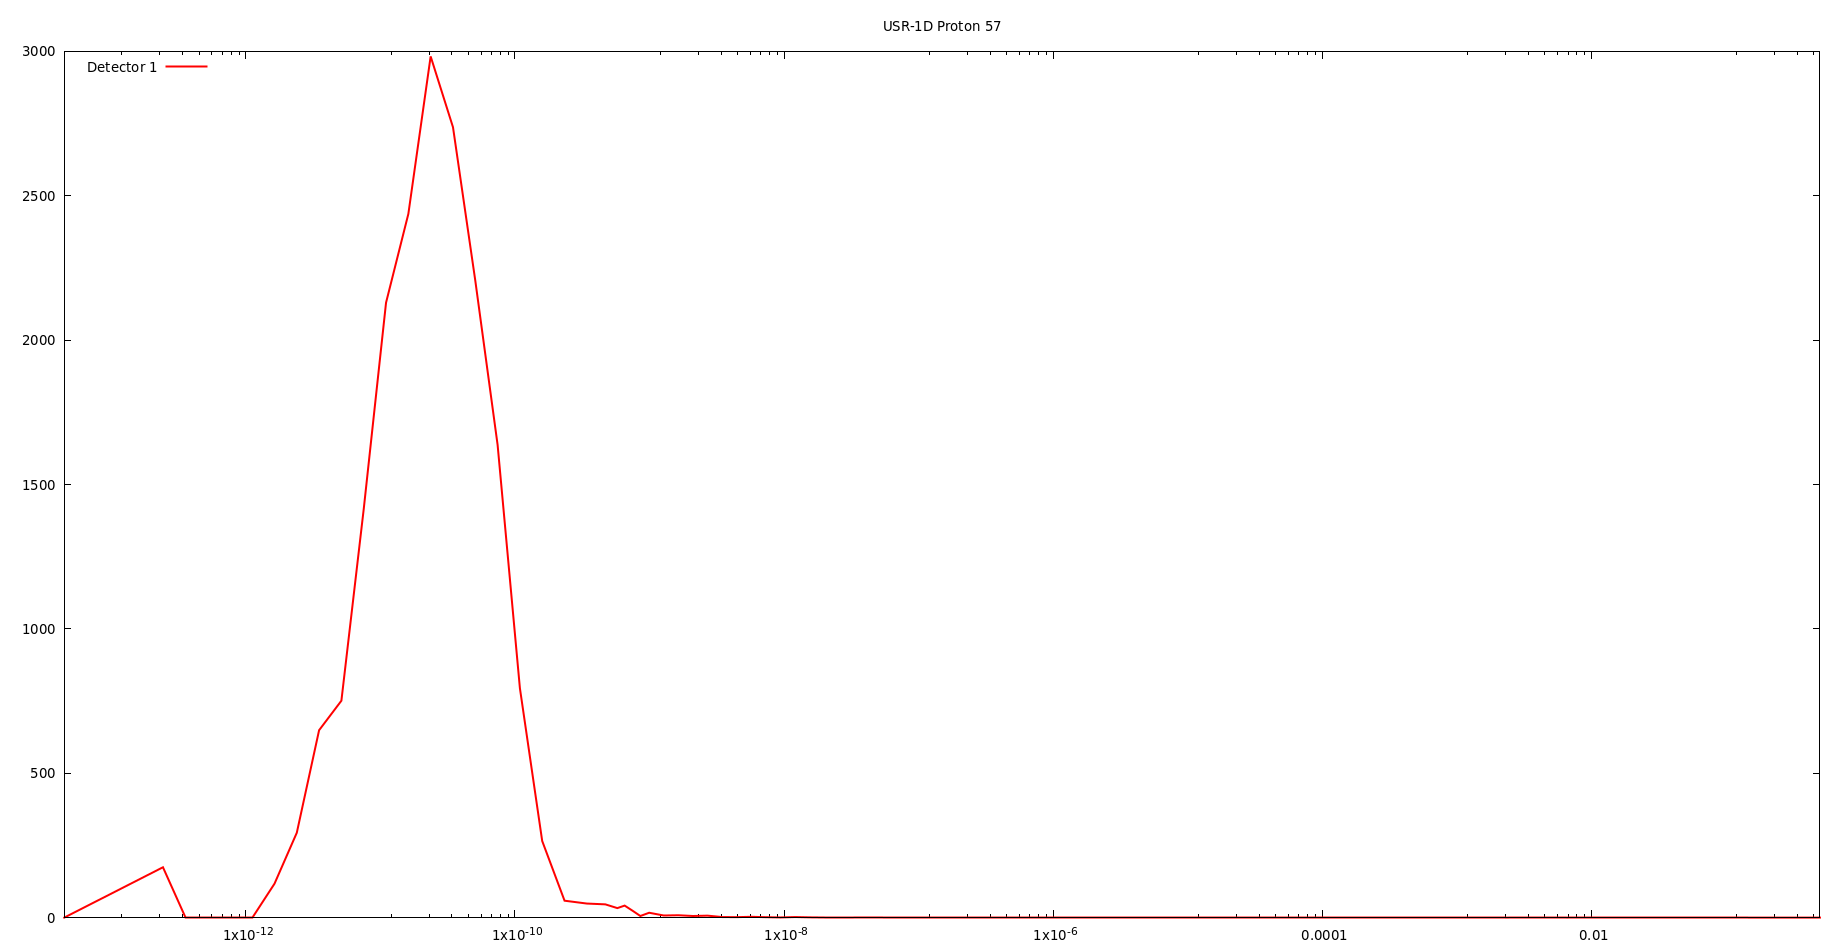
Plot without settings (exactly the data from file):
Also, I wanted to stress, that the drawing option here provided by GnuPlot, so you can search for needed commands in their manual or somewhere in the Internet, I mean this is not closely related to the Flair itself and forums with questions related to GnuPlot options/commands will be more helpful for that.