I have been using Fluka 2020, obtained in July from the Fluka web site.
I am working on a problem that needs photonuclear reactions in the energy range of 5 to 30 MeV.
Results seemed reasonable, but as a final check I thought I would install Fluka V4 from the CERN site. This now seems to be the official version.
To my surprise, the results are different. In one case, by 5 %, which might be OK, but in the other, by almost 50 %.
I have extracted the (g,n) cross sections by irradiating a thin slab with monoenergetic photons, and in the case of Ra-226, Fluka 2020 and Fluka V4 give very different results.
I can provide more details but does one expect major differences between these two codes?
To the extent that I have measured data to compare, Fluka 2020 seems closer to the truth.
Thanks @carl.ross for reporting.
The two codes follow different evolution paths. Nevertheless, for the problem of your concern, in general no major differences would be expected.
After better reading you, I understand that you refer specifically to Ra-(226-xn) production on Ra-226, we’ll have a look.
Best
When I did some simulations for photonuclear interactions with Ra-226 I could use directly radium as material in the simulation but I had to set a high neutron transport threshold. If I understand @ceruttif 's answer correctly, the low energy parametrization of the photonuclear cross section has not changed (and this paper is still the correct reference), right?
Or could the problem be related to the newly implemented electronuclear interactions? But I guess this effect would be irrelevant in a thin target simulation.
I do not think so, since these are mostly relevant for a thin target irradiated by an electron beam and, as you say, they play no role in case of direct photon irradiation.
Apart from the photon reaction cross section on 226Ra, connected to the above reference, differences might rather come from some specific ingredient in the reaction model, e.g. related to the nuclear mass/level database, possibly affecting certain production channels.
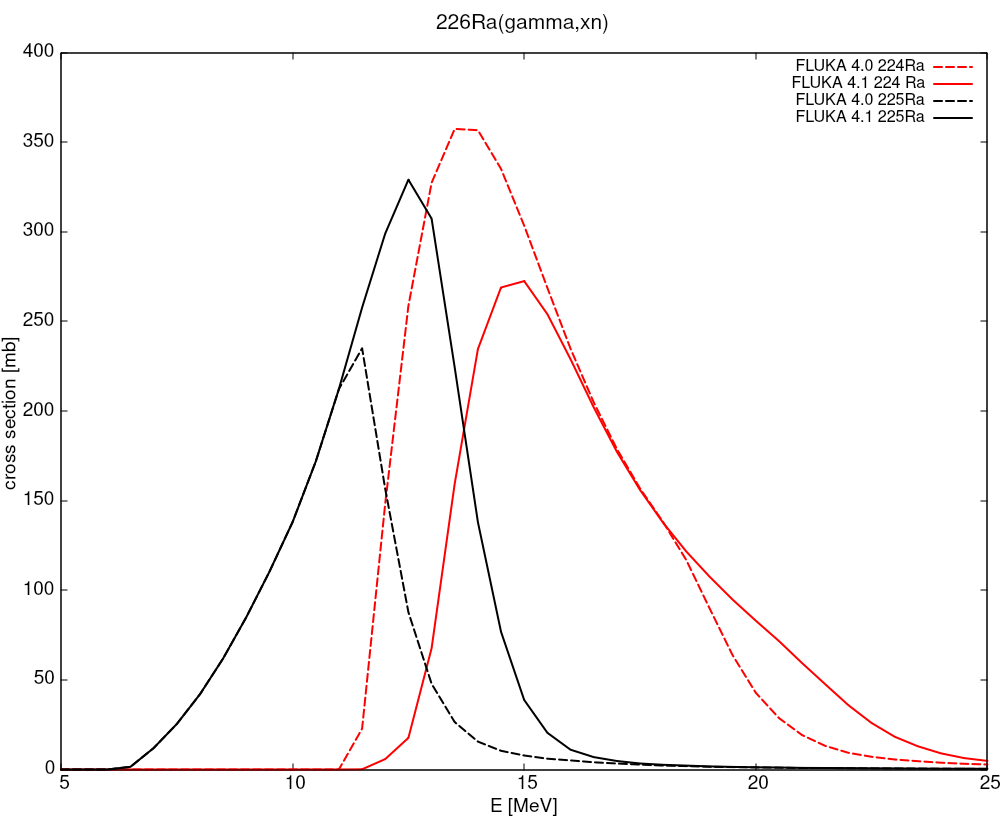
Thanks for your responses. The problem I am studying is the (g,n) production of Ra-225. When running the same card deck with Fluka 2020 and V4 I expected the same result within statistics, ~1 %. Instead, the results differ by ~ 50 %.
I then started looking at the (g,n) cross section for Ra-226. The results are attached. The V4 cross section is substantially smaller than 2020.
Incidentally, the (g,2n) cross section (not shown) is also very different.
There are no direct measurements of (g,n) on Ra-226 but the 2020 value might seem more consistent with systematics. It also gives better agreement with a published measurement of the Ra-225 yield.
(Done on Ubuntu 18.04, using the .deb package for V4)
Thanks again @carl.ross for pointing out this issue.
The reported discrepancy comes from the spin and parity account in the evaporation model, that is a new feature we did not have released yet being under test. Once it is included, the 225 Ra and 224 Ra curves change as in the figure: