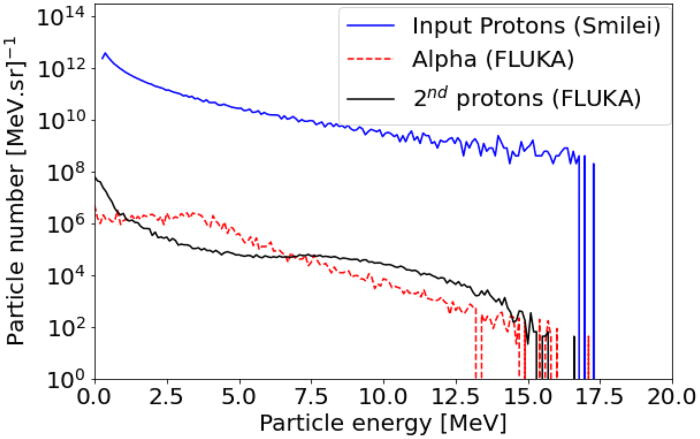
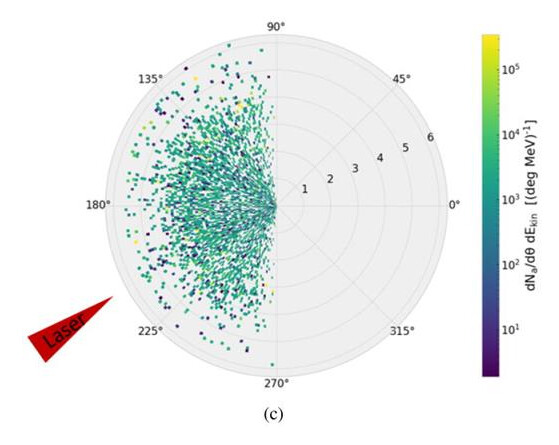
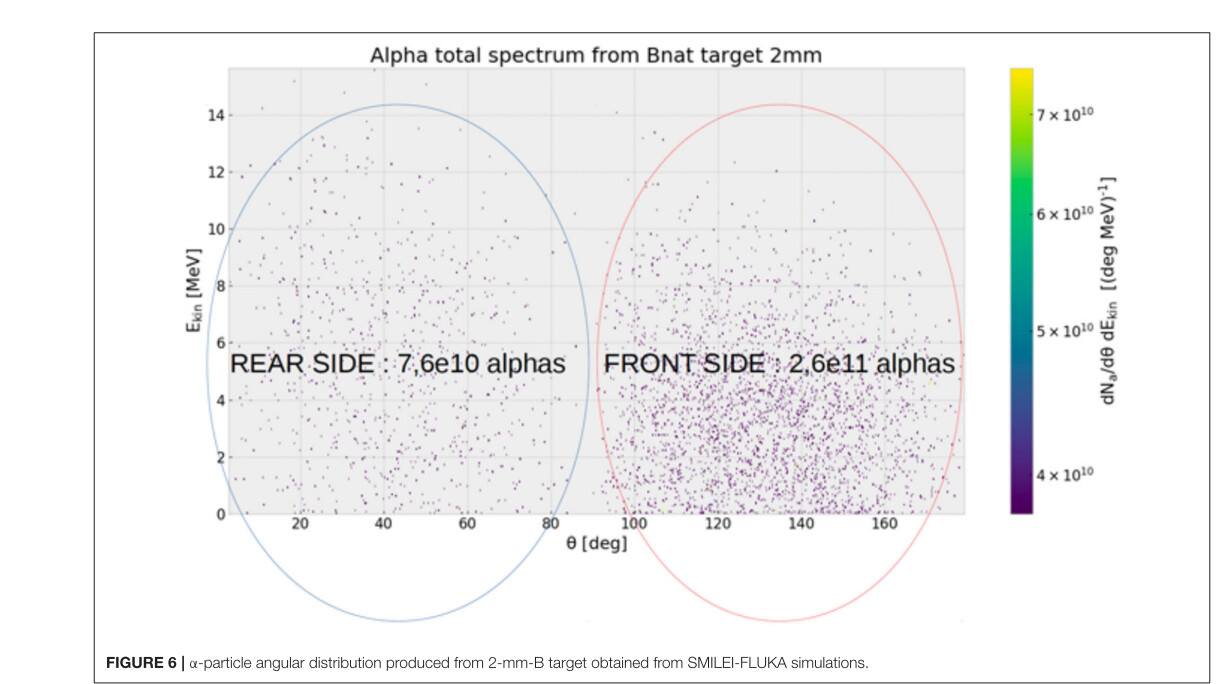
I need a plot similar to the above image. both 2nd protons and alpha particles. Input protons i am getting from EPOCH. Basically i need the spectrum of alpha particles and the protons and I also need to measure the angular distribution of the alpha particles (dn/dtheta*dE) (deg/MeV). Which scoring card i should use to get the respective spectrum and the angular distribution ?
The answer will depend on the what the angular distribution is relative to:
If you are looking for an angular distribution in solid angle (sr) with respect to the particles trajectory and the boundarythey are crossing then one could use USRBDX
USRBDX will provide a particle fluence or current (not particle number)
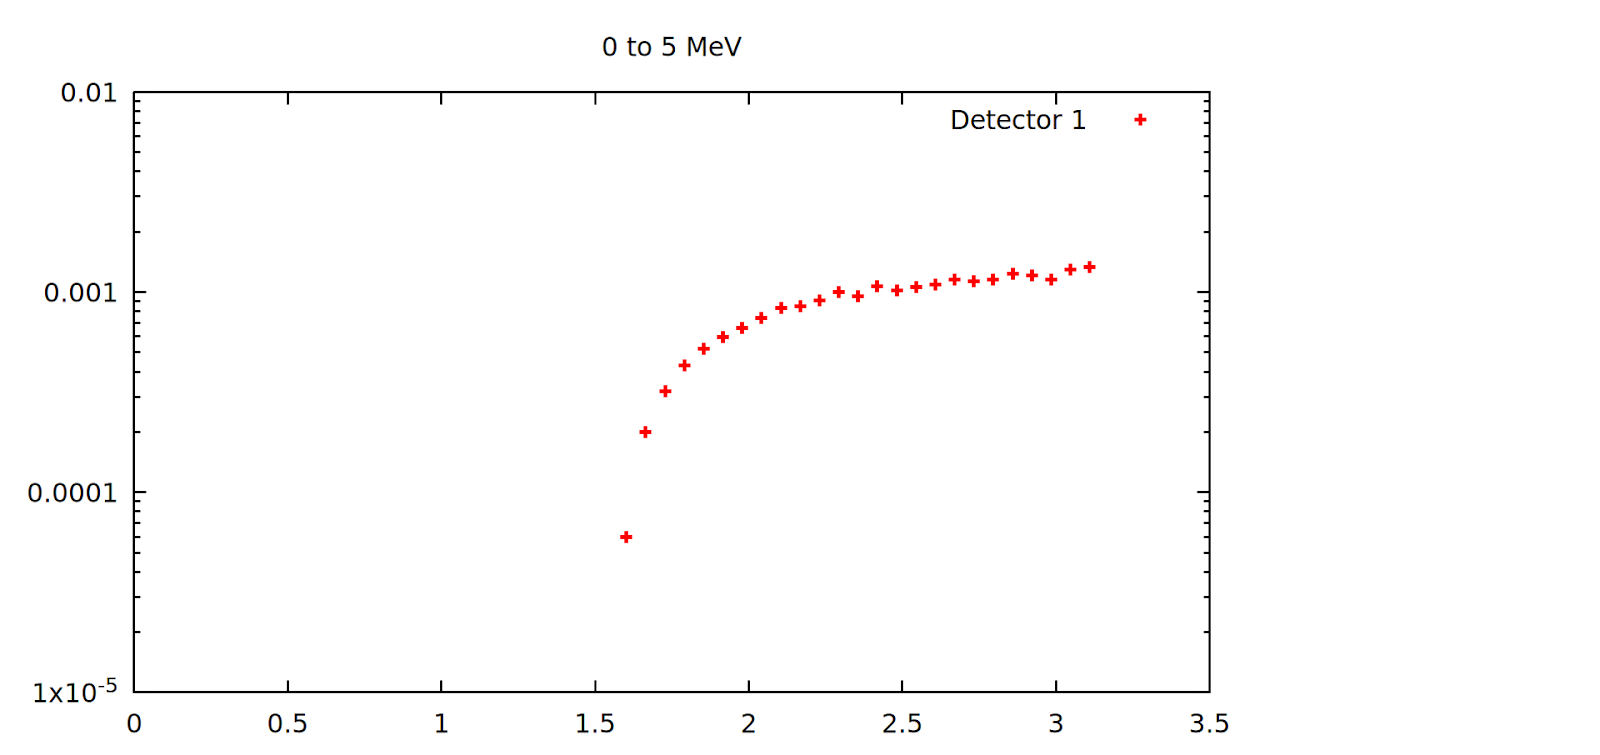
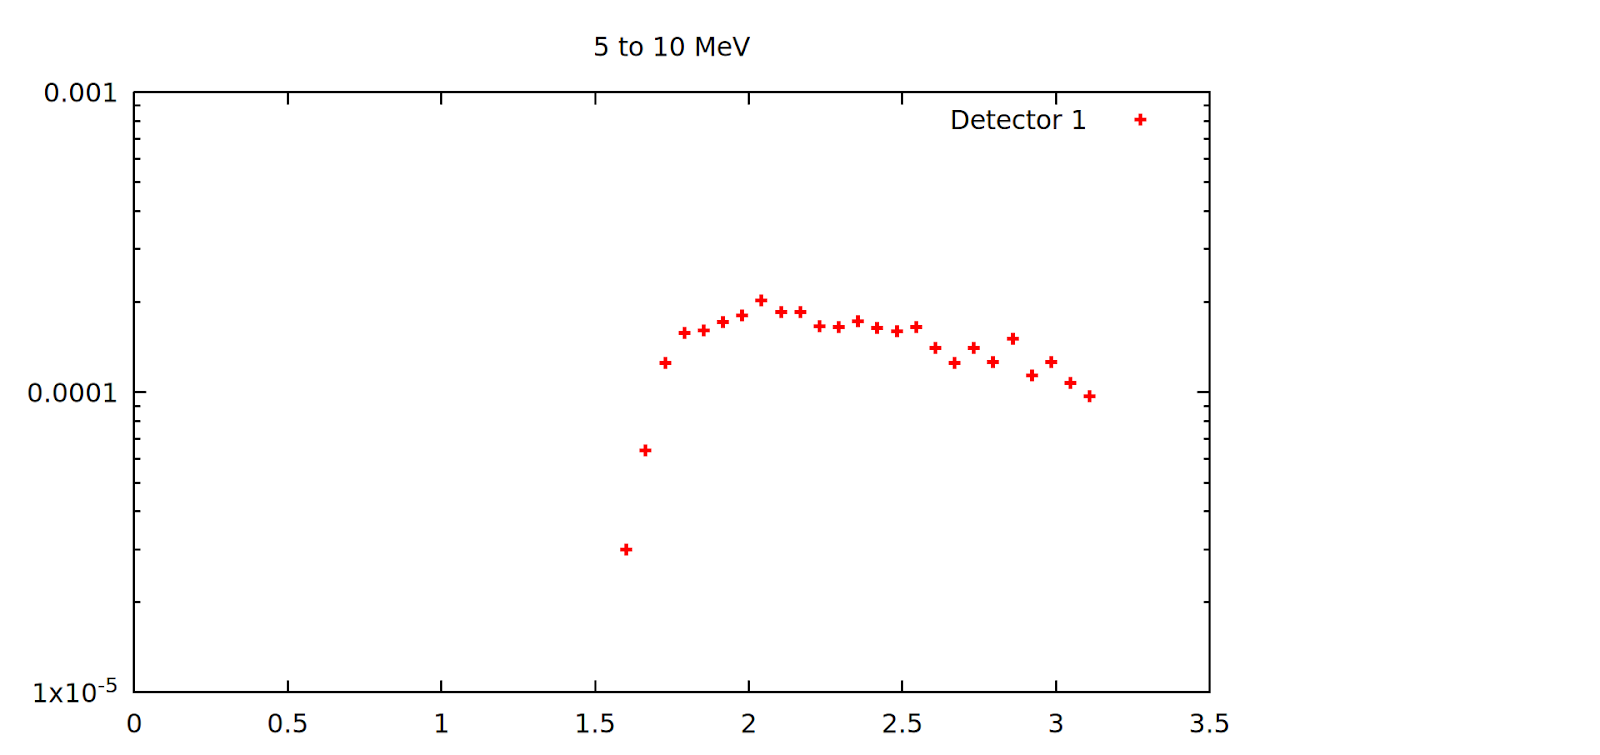
I have used USRYIELD and obtained the plot as below for different energies. But how to get polar plot as the above image for various energy and with same colorbar. Kindly help me on this regard.
I have used useryield card. But how to do simultaneous binning of both energy and angle like the above figure ? Can you please help me to get the exactly similar plot like this.
Are you experiencing an issue with the USRYIELD input (if so may you share you input file so I could more easily identify the problem), or with processing the output?
If it is regarding the output please consider:
Converting the output to the above plot is down to data processing, and use of python - FLUKA/flair will not produce a plot exactly like this.
USRYIELD gives the angle in polar angle, so double check your min/max values reflect this.
Be cautious about normalisation as I mentioned before.
In your case however, if you are considering the angle relative to the boundary crossing of your target - it may suit you better to use USRBDX.