Dear FLUKA Experts,
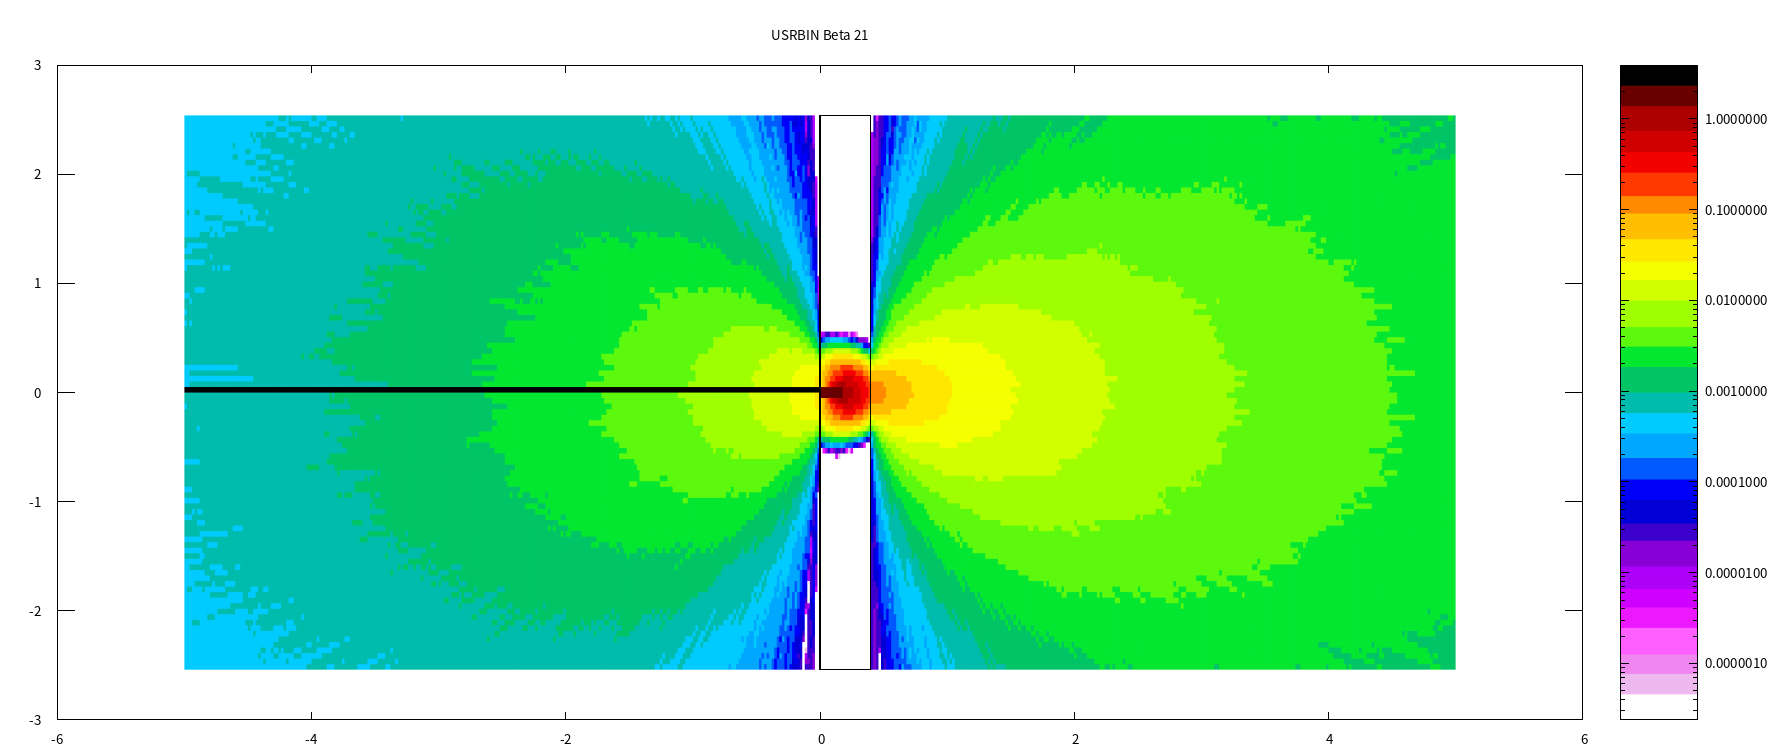
I want to calculate the range of electrons in the material. I use USRBIN card by setting type as X-Y-Z and part as BEAMPART. Then I got the results as follow:
I have some questions:
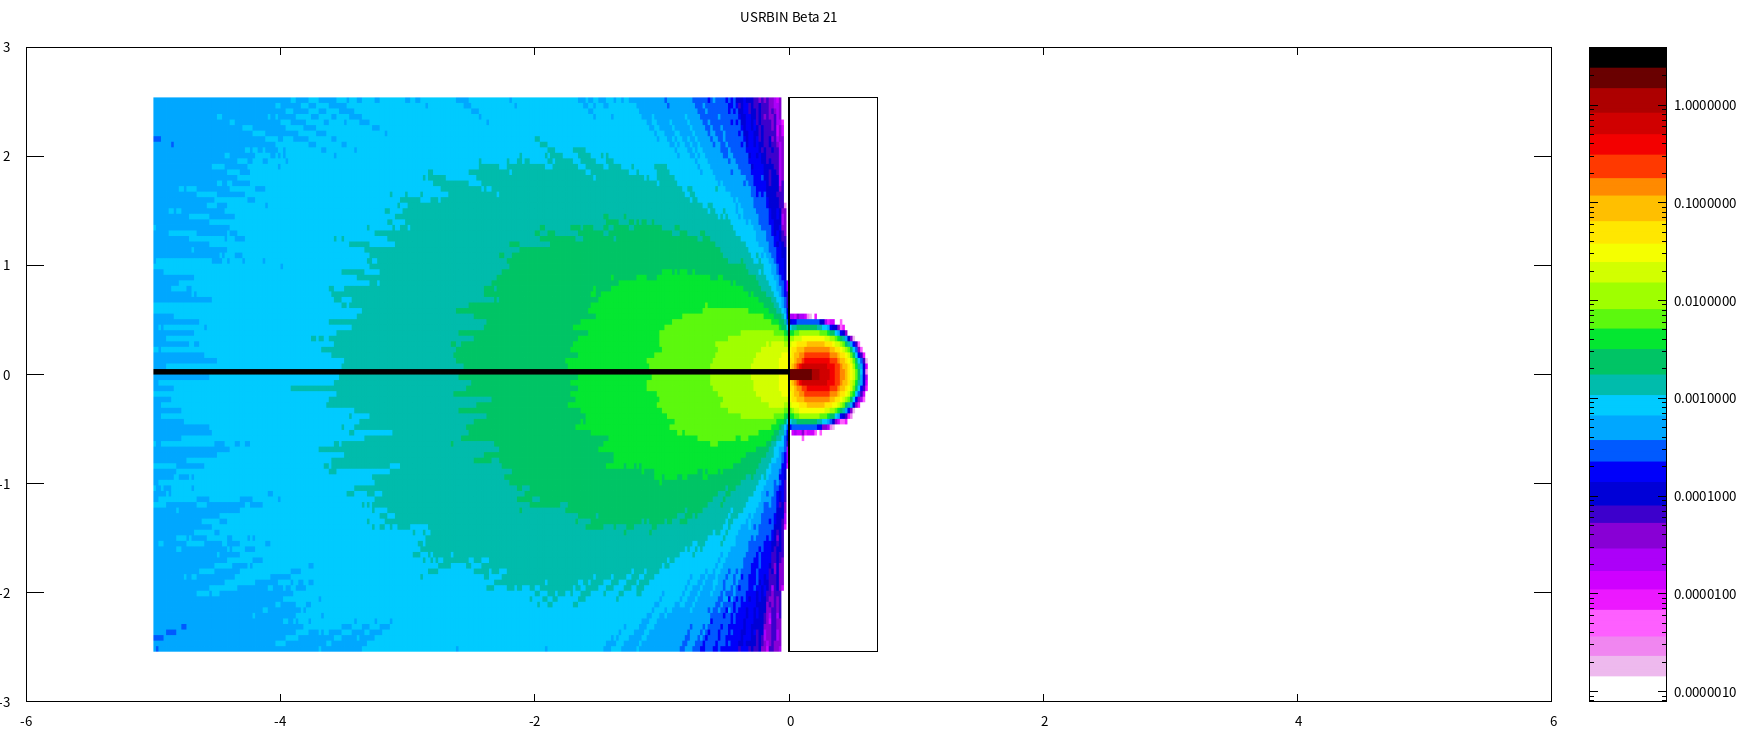
1.Can we think the thickness in the 2nd pirture is the range of electrons in this kind of material? This statement is not appropriate. In other words, can I use this method to calculate the range of an electron?
2.Can we thickness in second picture can prevent 3MeV electrons ?
3.I don’t quite understand the specific meaning of the beampart card. I think it is a card that records the source particles, and I guess the color depth in the 2-D projection picture specifically represents the number of source particles? Is that right?
Hello, you are trying to estimate the range of 3 MeV electrons traveling from left to right impacting on the rectangular material with varying thickness, correct? More specifically you want make sure that all electrons are all stopped inside the material?
To answer your questions:
Your approach to use USRBIN to estimate the range is appropriate. By setting WHAT(2) = BEAMPART you are scoring the fluence of primary source particles. If you set WHAT(2) = ENERGY you score the energy deposition, however in this case it is not only due to the primary electrons but also due to any secondary interaction. In both cases though you need to make sure the scoring mesh is well defined to resolve the particle range. For this, ensure the production and transport thresholds are properly set by taking into account the material properties and beam energy.
I assume you want to visually check if the fluence/energy drops to zero to make sure all electrons are stopped inside the material (and not scatter out as in the first picture), this you can indeed show using the 2D plot, you can also plot along the longitudinal axis using the 1D options in Flair.
As addressed above BEAMPART indeed selects only primary beam particles and what is plotted is the resulting fluence only due to these particles.
Dear @anwaets ,
Thanks for your reply! And your answer is very helpful. Yes, I want to find the most suitable thickness to prevent 3MeV electrons in the material. But I still have some doubts:
1.You said that I need to make sure the scoring mesh was well defined to resolve the particle range. Does this mean that the smaller the grid I need to divide, the better?
2.Which material property do I need to set?
3.Do I need to set up 1 keV for β thresholds and 100 eV γ threshold by using an EMF-CUT card?
4.I simulate 1E6 particles, Whether the fluence result is normalized?Because the fluence of some area in the 2-D picture is >1, but all the fluence is <10, and the sum seems to be much less than 1,000,000.
5.I understand the unit of BEAMPART Card is primary source particle/cm^2, is that right?
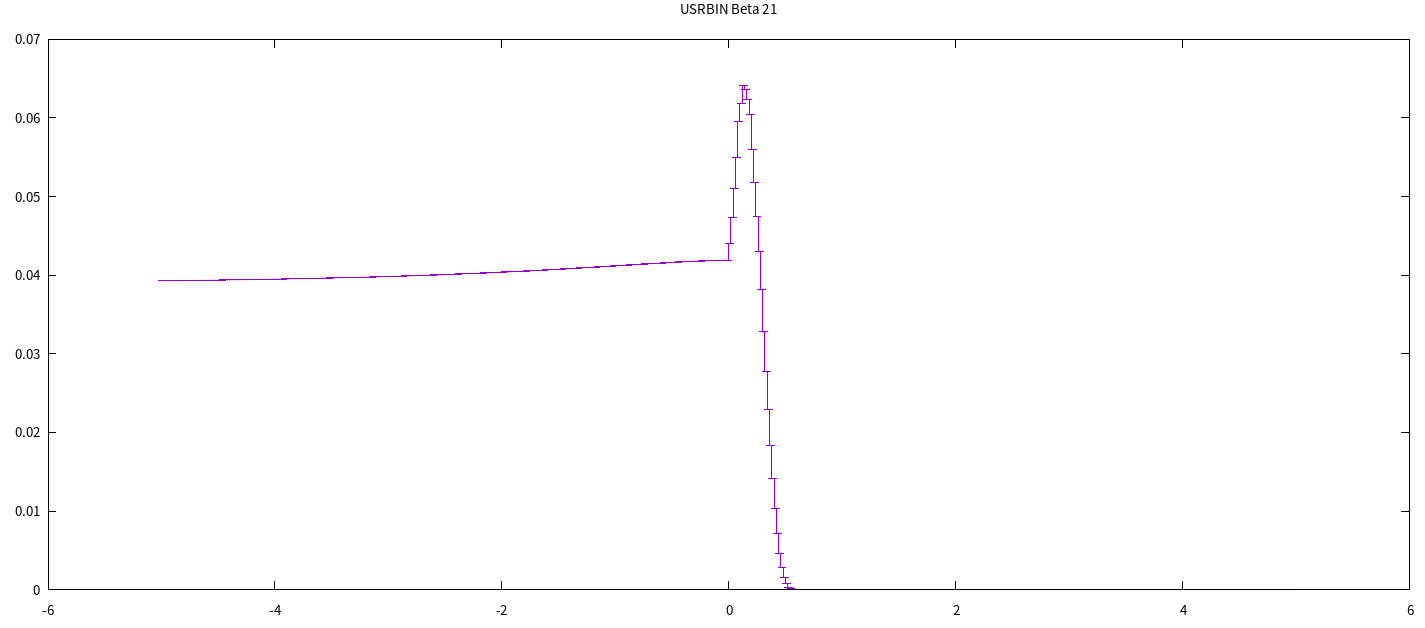
6.I plot the 1-D projection, Does the ordinate value represent the integral of fluence for all grids of the same thickness?
Hi, you are on the right track with most aspects, again answering your questions in sequence:
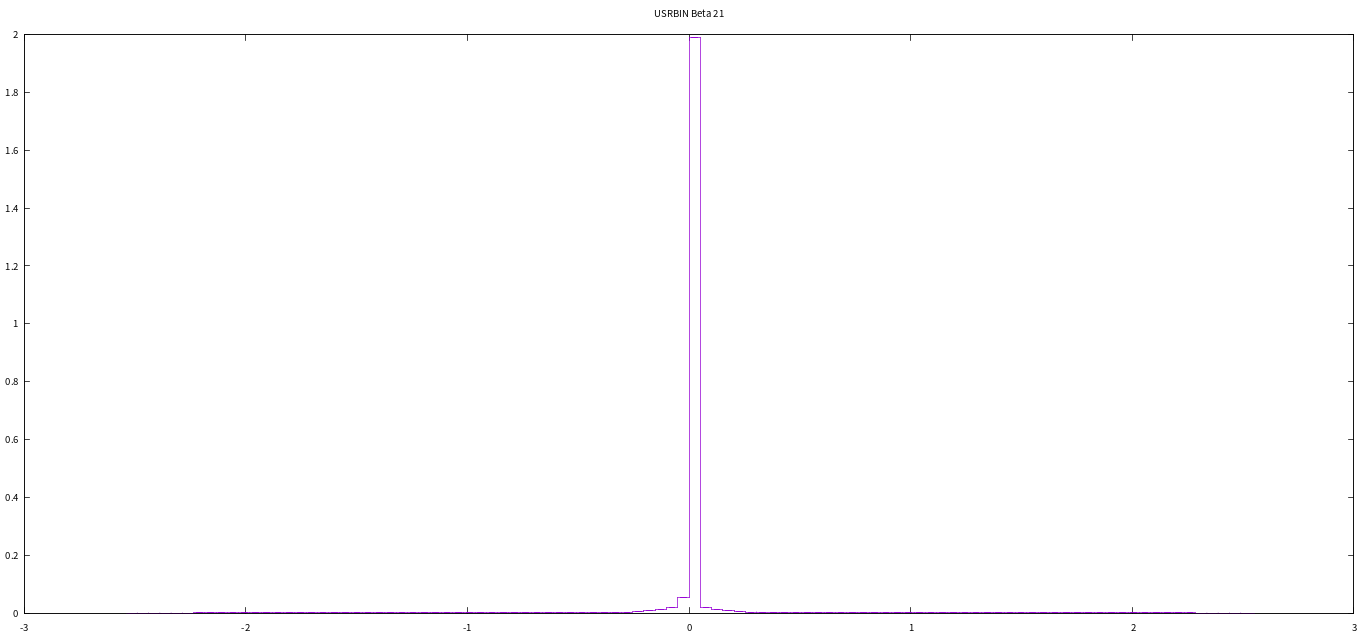
Not necessarily, if you define smaller bins the resolution is better but large statistical fluctuations between adjacent bins are possible. In other words, the bin volume should be large enough to avoid these fluctuations since an average is taken inside each bin. However the bin volume should also not be too large such that taking this average in each bin does not obscure the physical results. Since I believe you are working with a straightforward, narrow beam, a good check would be to plot the 1D Max along either transverse axis at any longitudinal coordinate inside your target and see if you obtain a resolved Gaussian distribution with small error bars.
The properties such as the atomic target composition and density are of course up to you to define for your study. The target material properties affect the range of the electrons.
If you set a DEFAULT card with SDUM = PRECISIO these EM particle cuts you quote are automatically assumed for all regions and materials. The EMFCUT cards can be used to set specific thresholds on a material and region basis. A good rule of thumb is to make sure that the scoring bin size length is larger than the range of the particles at the transport threshold value. For this you could use for example the ESTAR database.
The results in FLUKA are expressed per primary simulated, regardless of the amount of primary particles simulated. Setting the correct normalization when plotting the results is therefore entirely up to you.
To be fully correct the units of the output are [cm^-2 primary-1] (per square cm per primary) since results are expressed per primary simulated.
For the 1D projection the values along the other axes are averaged, i.e. if you’re plotting along the Z-axis the results shown are the average of all bin values corresponding to any particular Z-coordinate. In other words you’re plotting the value for each “slice” of Z taking into account all bins along X and Y as well.
As you said, the units of the output are [cm^-2 primary-1] (per square cm per primary), What I understand is that it calculates the fluence of 1 million primary particles or more, and the final result is the average.
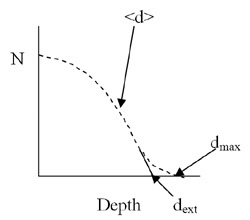
Hi, I think you plot the 1D max profile at the material boundary on coordinate Z = 0? Since this is where the beam impacts the material the fluence of primary electrons is very high inside one single bin. Try to plot again at coordinates Z = 0.1, 0.2 or 0.3 deeper inside the material, the goal is to achieve a Gaussian profile instead of one where there is a peak inside one bin. It is possible that you need to increase the amount of transverse bins to achieve this. For your study however it is important you achieve a smooth profile along the Z-axis which will not be Gaussian but will more have a profile likes shown here. No visual error bars can be a result of having gathered more than sufficient statistics, in this case they are just too small to see. In case you run less primaries and increase the amount of transverse bins you should see the error bars appear. Indeed after running 1 million primaries the result shown is still the average expressed per primary.