Questions about energy deposition of electron beam on tungsten target

Dear fluka experts and users,
Im running a simulation where i use electron beam of 120Mev energy and i use a target of tungsten.i see in the runninng results the following :
1.
1.9948E-01 (100.) GeV available per beam particle divided into Prompt radiation Radioactive decays 0.0000E+00 ( 0.0) 0.0000E+00 ( 0.0%) GeV hadron and muon dE/dx
4.1750E-05 ( 0.0%) 0.0000E+00 ( 0.0%) GeV electro-magnetic showers
0.0000E+00 ( 0.0%) 0.0000E+00 ( 0.0%) GeV nuclear recoils and heavy fragments
0.0000E+00 ( 0.0%) 0.0000E+00 ( 0.0%) GeV particles below threshold
0.0000E+00 ( 0.0%) 0.0000E+00 ( 0.0%) GeV residual excitation energy
0.0000E+00 ( 0.0%) 0.0000E+00 ( 0.0%) GeV low energy neutrons
1.9944E-01 (****) 0.0000E+00 ( 0.0) GeV particles escaping the system
0.0000E+00 ( 0.0%) 0.0000E+00 ( 0.0%) GeV particles discarded
0.0000E+00 ( 0.0%) 0.0000E+00 ( 0.0%) GeV particles out of time limit
-2.1590E-08 (-0.0%) GeV missing

what does it mean?do all the particles escape the system?and if so how do we take results about the energy deposition ,as all particles leave without none of them to stop?do we count the amount of their energy that they leave?but no energy is deposited by EM showers ?
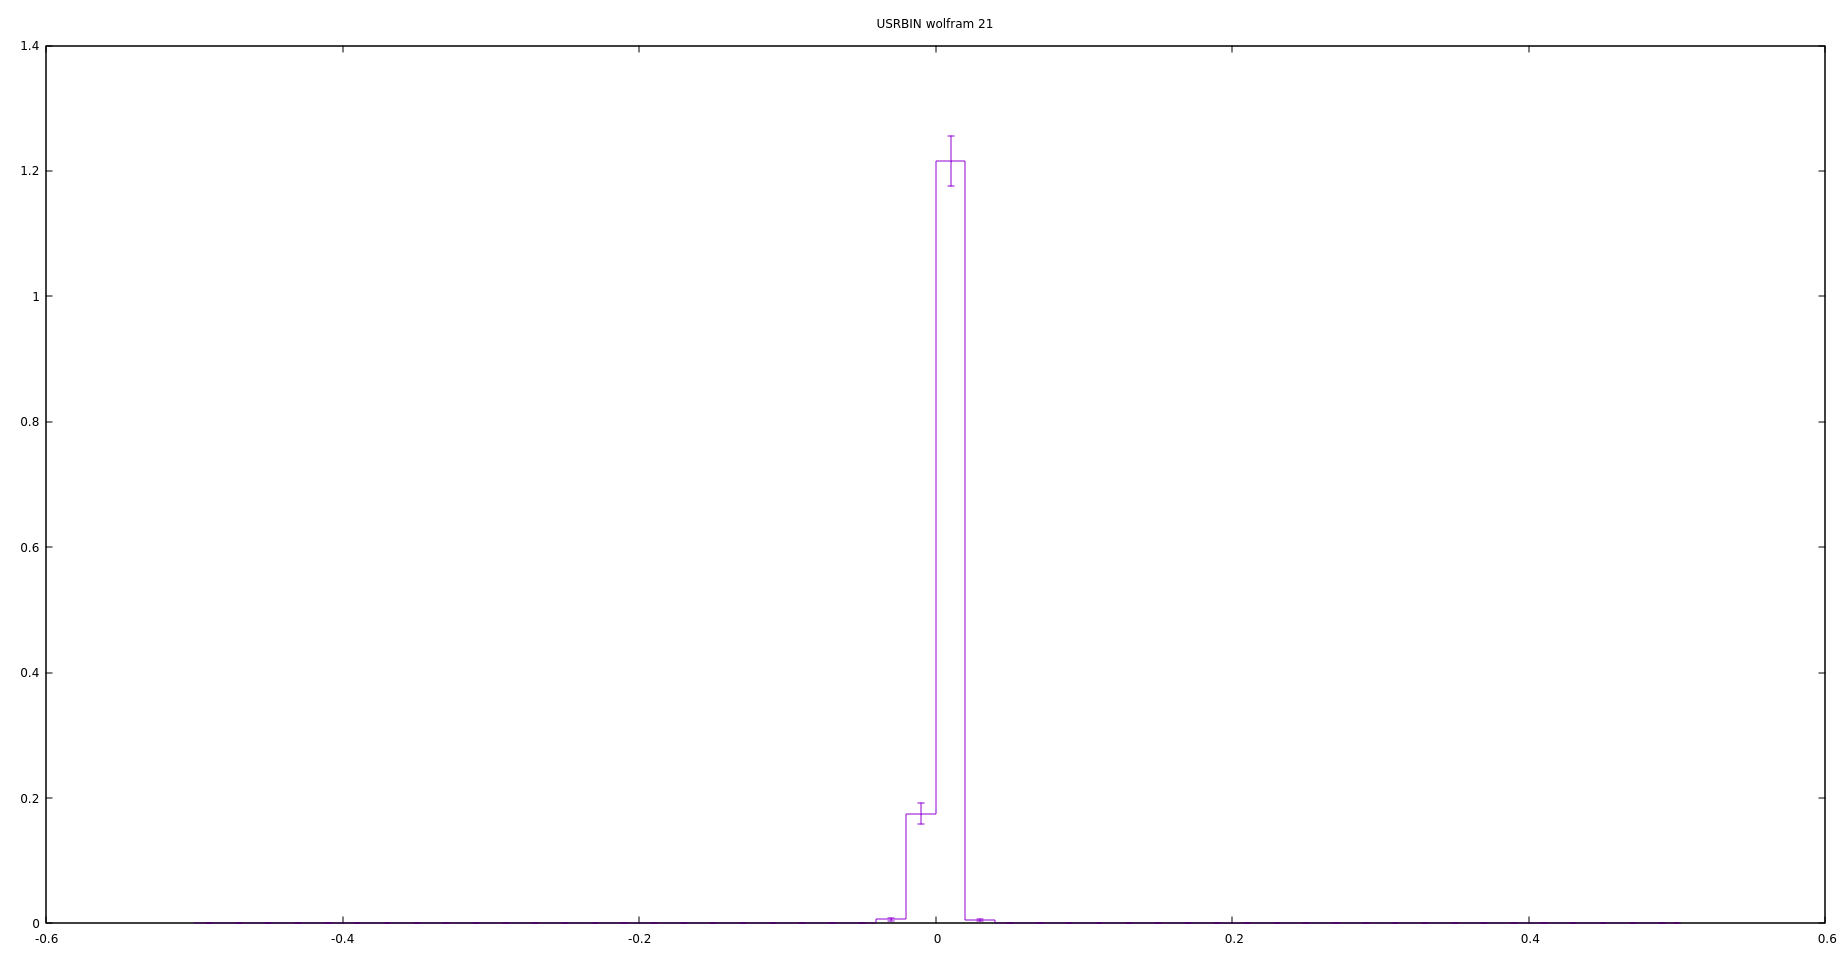
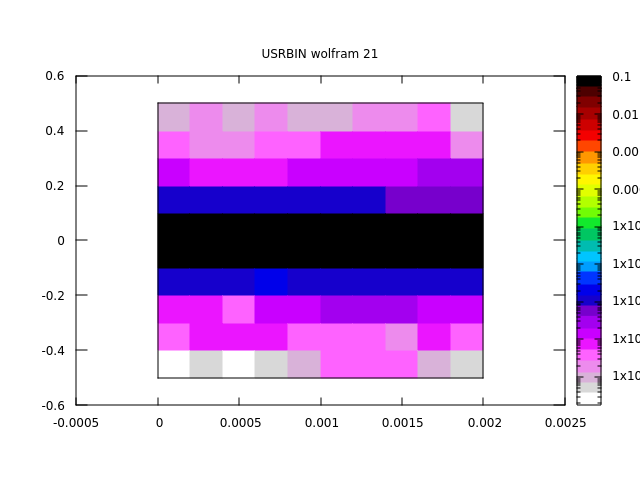
2. the energy deposition dencity is high only very close to the beam and there is almost no energy deposited on the rest of target’s width .is this normal?
image
3.also in order to plot the particle fluence spectrum,should i choose the y or *y demonstration at USRBDX and USRTRACK(in usrtrack i chose linear climax ?)
4.i was asked to have a beam of charge Q=75pC per bunch ,which means 468.113.182 electrons.Was it right to put this as the number of primary histories,or it has another meaning?
im attaching my flair file:
wolfram.flair (2.2 KB)

im looking forward for you reply .thanks in advance!

Dear Artemis,

Given the very thin target (20 ÎĽm), it is not surprising that 120 MeV or, indeed, ~200 MeV electrons as you have actually defined in your input, only lose a very small fraction of their energy in the target and proceed to escape from the geometry. Note that energy deposition does not necessarily imply stopping the particle. Indeed, your energy deposition spectrum shows this. And you mention EM showers, but with 20 microns you are barely seeing the beginning of one. Try 20 cm and see what will happen.

This also explains why most of the energy deposition is concentrated very near the beam axis. Any contributions further away will mostly come from photons, and it may take a while to accumulate enough statistics there.

So the question is whether you had radically different expectations and why. Did you mean to study a thicker target?

For logarithmic binning, <X>*Y would be appropriate, DX*Y works fine for differential spectra over a linear binning. You will certainly find other threads in this forum covering this point.

As for your last question, it touches upon a fundamental concept. All the results you get from your scoring are given as a value per primary particle. E.g., if you look at energy deposition, then the value you get is the average energy deposition of a primary particle, as obtained from averaging the contributions of each of the primaries you have run. This result can be scaled to any beam intensity - in your case, simply by multiplying it by 468,113,182 to get “energy deposition per 75 pC bunch”. This does not mean that you must run exactly this number of primaries, which in many realistic cases is practically impossible. You just need to run enough so that your scoring (which is an average over primary particles) sufficiently converges to a value with a reasonably small uncertainty. Running, say, 10 electrons is manifestly not enough, but a few thousand might already suffice - it really depends on the problem.

You could have a look at this lecture, it explains this concept, among other things:

A few additional comments on your input:

Keep an eye on the energy ranges you request in your USRBDX and USRTRACK cards, they seem somewhat inconsistent. In some cases your lower boundary is lower than the transport thresholds you have set in EMFCUT; not a problem, but superfluous. Also in some case you cut at 120 MeV, which clashes with your 200 MeV beam definition; of course most energy deposition events will be in the MeV range, so it may not matter so much, as long as you are doing it on purpose.

Check your beam energy, make sure you are running what you really want.

For the USRBINs, you may consider defining them so that there is a single central bin where the beam hits, rather than hitting at the boundary between two bins. E.g. you can define X/Ymin = -0.55, X/Ymax = 0.55, Nbins = 11, still getting 0.1 cm bins.

Cheers,
Andrea

P.S. Careful: “κλίμακα” = “scale” (in this case, “binning”)

1 Like

Thank you very much for your reply,i understood many thinks better! i runned the simulation for 2 different energies of electrons 300Mev and 120Mev.
Some more questions about scoring :
1.what scale scould be used for the detect card ?linear or logarithmic,and what kind of units should i put on the plot axes?also im not quite if ive understood pretty well what means coinsidence and anticoinsidence with the trigger.what ive understood is that it detects the energy deposition spectrum of all the particles ,primary and secondary,all together if they have energy above the cut-off,if they have lower it doesnt count them .does it provide extra information in my case or am i complete with usrtrack and usrbdx ?
2.the usrbdx card provides as output both .tab.lis and sum.lis files,the plot uses the first one.as i read the second one provides the energy integrated cumulative spectra.what is the physical meaning of the later,does it provide useful information in practice ?
3.i have done 2 different runs of the simulation one with 120M and one with 300M ellectron beam.is there any way to put the results on the same plot :for example the 1D energy deposition projecton of 300M electrons with red color and of 120M with green ?
thank you in advance

and something last.is it ok if i dont see symmetrical results eg in x and -x axes ,eventhought the beam and the target are symmetrical ?

Dear @el16044

Good to hear things are clearer.

(1) Let’s summarise what information you get from each scoring.

The USRTRACK scoring gives you particle fluence inside the target volume.
The USRBDX scoring gives you particle fluence crossing the boundary between the target and the void, i.e. particles exiting the target.
The DETECT scoring gives you energy deposition in the target.

Only you can say which information is useful to you. What quantity are you interested in? If it is only energy deposition in the target, then USRTRACK/USRBDX may be less interesting. Keep in mind that you can also obtain a total energy deposition value in the target either via a USRBIN card scoring ENERGY per region, or via the information printed in the standard output file - for the latter see:

The scale for the DETECT card is linear by construction, with the energy range between Emin and Emax divided into Channels of equal width. The coincidence/anti-coincidence option is relevant in case you have multiple detectors and want to simulate a coincidence/anti-coincidence setup, so you can ignore it for the moment.

By the way, the transport threshold affects all your scorings, not just the DETECT card.

(2) The meaning of the cumulative distribution is simple. For a given energy bin, it represents the sum of all bins up to that one, i.e. it is the integral of the fluence from the lower bound of the histogram up to the specific energy. You could very well calculate it on your own based on the *tab.lis, it is provided for convenience. Again, it is useful if you are interested in this quantity (e.g. what fraction of electrons/photons have an energy lower than 1 MeV?)

(3) Yes, there is. In the Plot tab, add a new USR-1D plot. Then, in the “Detectors” box, just add (click the plus sign) the appropriate files to plot, set the line colour for each etc. and plot.

Concerning your last plot, I would point back to my suggestion in the previous response about defining your USRBIN meshes so that there is only one bin around the beam axis, rather than two bins with a boundary exactly at x=y=0.0, which creates an ambiguous situation when combined with a pencil beam.

1 Like

Thank you very much.The only problem is that when i set the limits xmin=-0.55,xmax=0.55,Nbins =11
and the same for y axis ,the plot is empty !does it have to do with the fact that the target’s limits are ±0.5 and the rest is vaccum?if i set 11bins for xmin/max=±0.5 it still doesn’t work

This should not be the case, especially if you simply change the number of bins. Did you perhaps also change the z-limits, therefore moving the entire USRBIN mesh to the vacuum, where energy deposition will of course be zero? I would suggest you take a careful look at your input, other settings you may have changed etc. If you do not discover the explanation on your own, then share your latest input and we can take a look.