Dear Lovepreet,
Thanks for your feedback and for providing us with complete information to address your question.
For your question (~7 MeV e-) we can focus on a purely electromagnetic problem (e- and photon transport).
If you do a run with EMFCUT cards setting high production and transport thresholds for photons, you will still see the same behavior at shallow depths in the energy deposition spectrum as a function of angle, so we can safely ignore Bremsstrahlung photons for this discussion (they do matter of course for a quantitative analysis and to explain the tail in the depths of your geometry, but this is now not essential to address your doubt of the near-surface behavior).
We are then left with the electrons. The basic ingredients for e- transport at these energies are:
It’s now a matter of examining the (coupled) effect of both in your scenario.
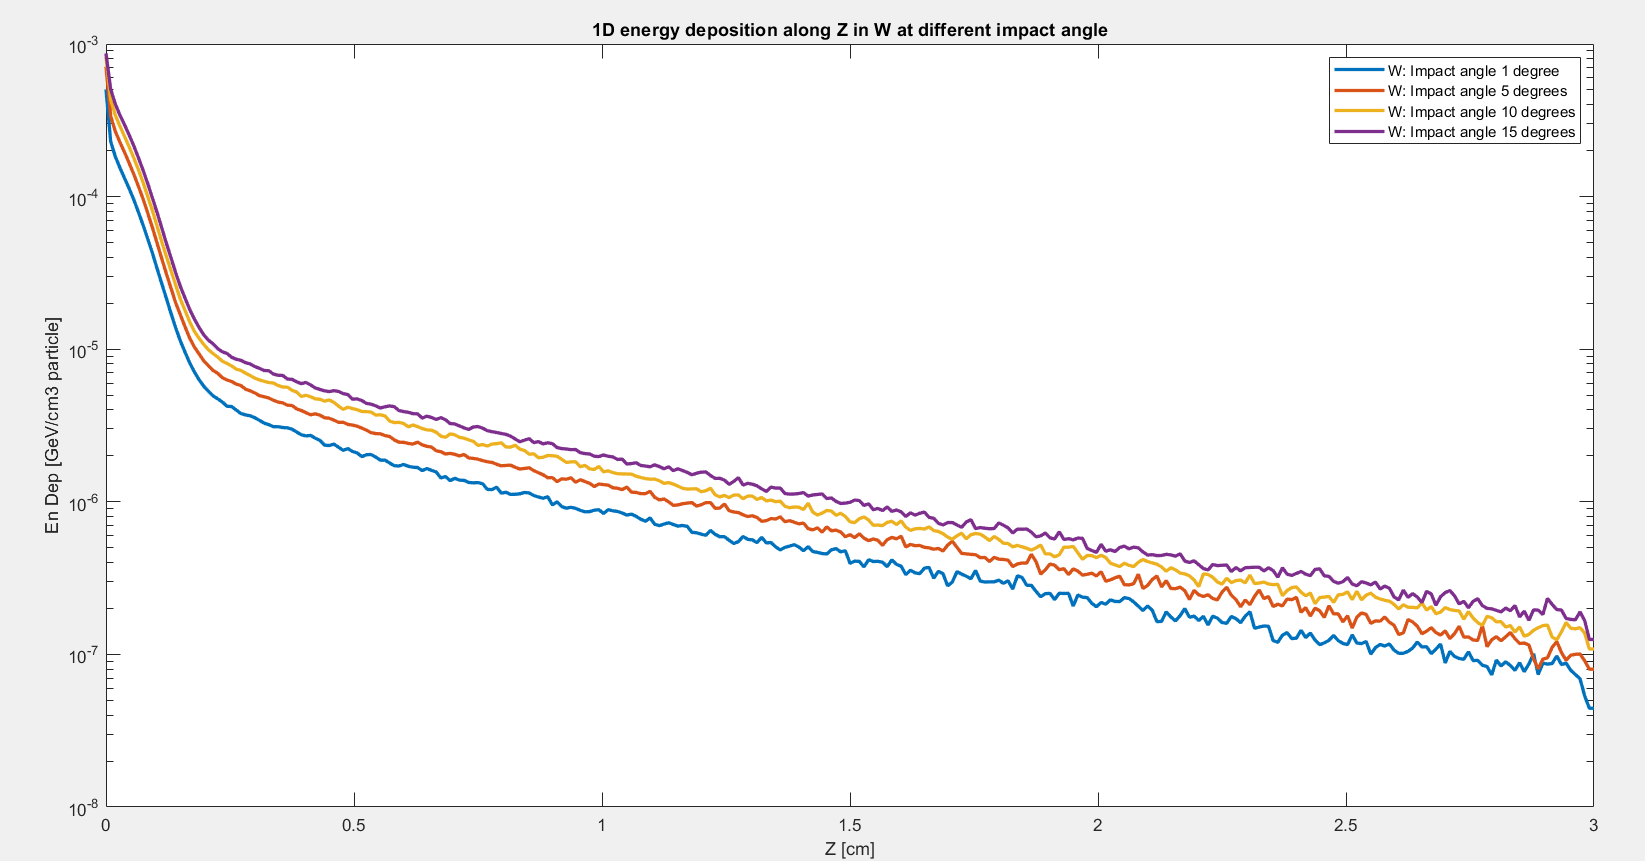
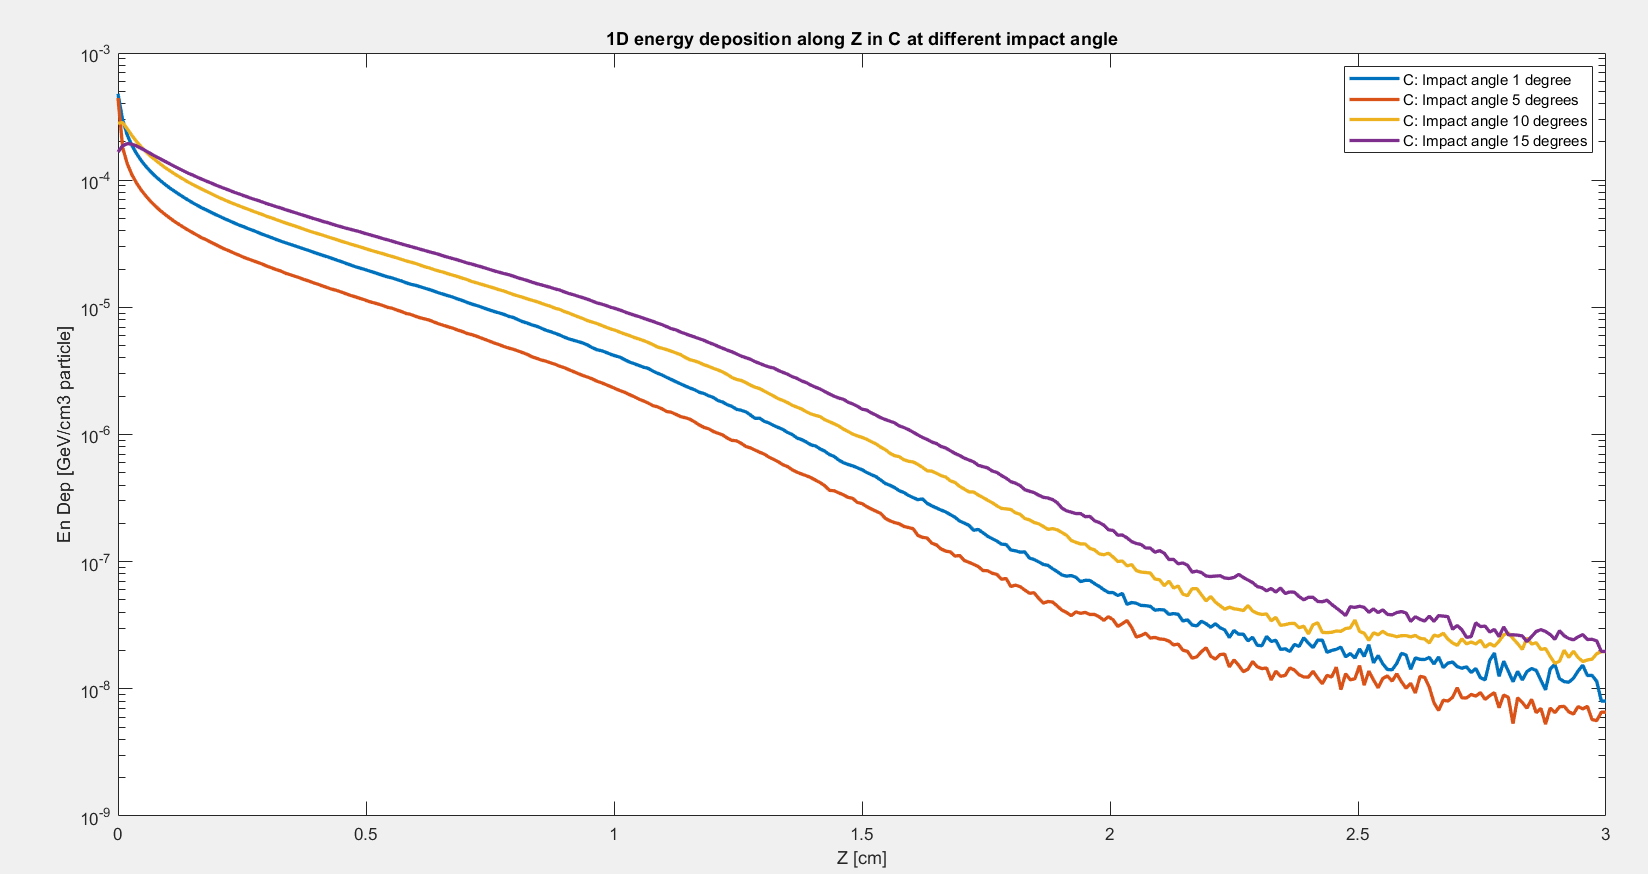
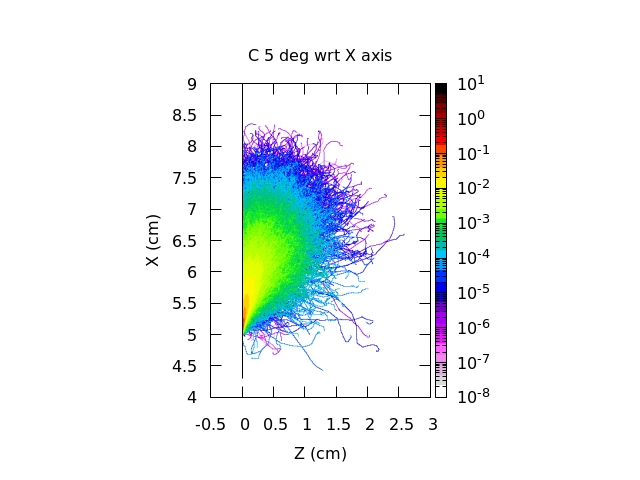
Since electronic stopping scales with the target material density, you’d qualitatively expect the energy deposition profile to be much more compact for W (rho=19.3 g/cm^3) than for C (rho=2 g/cm^3). Indeed, here is the 2D energy deposition plot (USRBIN) for e- in the present exercise (slightly distorted since we forget about photons) in W and for C for 5-deg incidence with respect to the X axis:

The drastically different spatial extent of the 1D energy deposition profiles in your original post for W and C is then reasonably explained (the missing “skirt” dragging things down to deeper depths is mostly Bremsstrahlung-induced).
The next piece of information: elastic scattering scales with the square of the target atomic number. Thus, elastic scattering is a factor ~(74/6)^2 ~150 more effective in W than in C, meaning that the electron shower in W will promptly “lose memory” of the initial e- direction and will quickly exhibit an isotropic angular distribution after a modest traveled distance, hence the isotropic blob in the W plot.
Instead, since the cross section for elastic scattering is lower in C than in W, electron showers in C develop to longer distances before loosing memory of the incoming e- direction. Indeed, if you look at the blue/purple shades in the C plot above things are fairly isotropic, but in the early red/orange/yellow regions of the e- shower, the initial direction is still remembered (elongated feature retained instead of a promptly isotropic one).
Let’s look now at the 15-deg angle (with respect to the X axis) case for W and C:
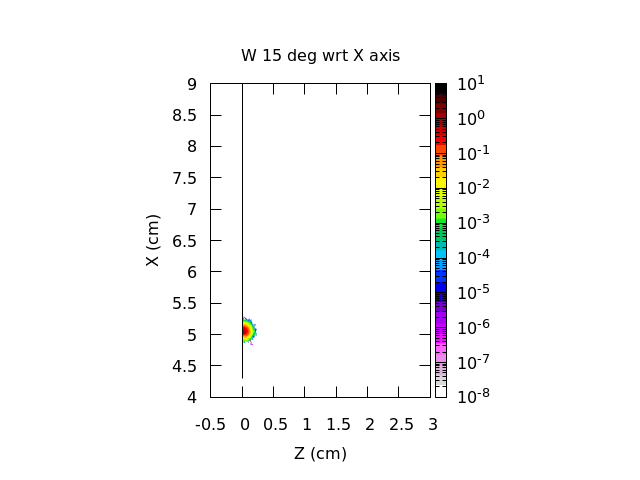
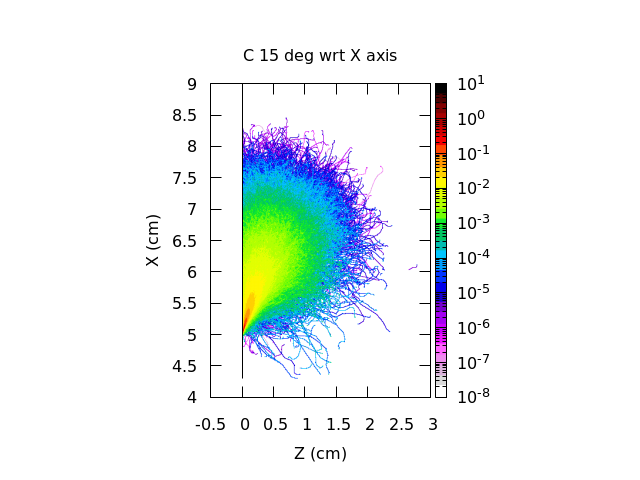
Whereas for W the shape remains essentially indistinguishable from that in the previous plot, for C things are substantially different. Given the less effective elastic scattering, memory of the initial direction is retained for longer path lengths. This, combined with the lower stopping power in C than in W, implies that the e- shower subtends longer path lengths while still preserving a “blob” around the initial direction.
For 5-deg incidence, it turns out that the blob is “cut” still fairly symmetrically by the X axis, so you see a monotonically decreasing behavior in your energy deposition profile. For 15-deg, the “blob” is now fully
contained in your C, so the meat of the energy loss distribution shifts to deeper depths, hence the bump/maximum you witness.
In a nutshell: you’re seeing the combined effect of elastic scattering and electronic stopping, in a grazing incidence condition, which is sensitive to transverse details of the early development of the e- shower. Looking at a 1D distribution (along Z) only, one of course loses sight / valuable information in the other dimensions (X here), which give deeper insight.
I hope this qualitative explanation helps somewhat…
Cesc