Hi Irina,
It seems to me that the LET plotting you’re obtaining is directly produced from the 1-D projection plotting of this card:
USRBIN            10    ENERGY       -22        56         2         2EneDep
USRBIN            54        -2       -2.       200       200       200 &
However, I’m afraid this is not the correct way to proceed. In general, scoring LET in FLUKA is a non-trivial task, and I think these two posts might be very useful for you: Strange LET shape for 800 keV protons in LiF - #5 by msabateg and Difficulty scoring LET, Dose and Energy for protons in water.
Regarding your approach, you’re attempting to observe the LET deposited energy by performing a transversal integration of the USRBIN result. There are two key elements missing in your normalization:
- The surface area of the USRBIN slice (since you’re doing a projection, you should multiply the results by the transversal dimensions of your USRBIN, i.e., 4*4 = 16).
- The normalization factor: GeV/cm → keV/μm = 100.
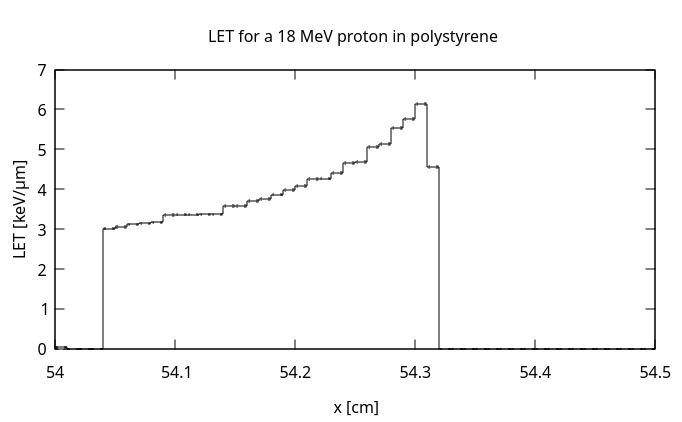
With these adjustments, I ran a quick simulation for your 18 MeV case, and the results seem to agree with the NIST stopping power table (https://physics.nist.gov/PhysRefData/Star/Text/PSTAR.html)
I also noticed that you organized your run using several if/elif conditions. While this works, it’s not the most efficient approach. I’ve reorganized the different energy cases using Flair’s function evaluation capability (F3.6} Function evaluation). You can find an updated flair file here:
24godeuri.flair (10.2 KB)
Have a nice day!
Cheers,
Daniele