Dear fluka experts
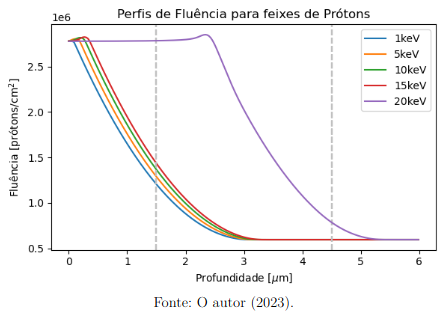
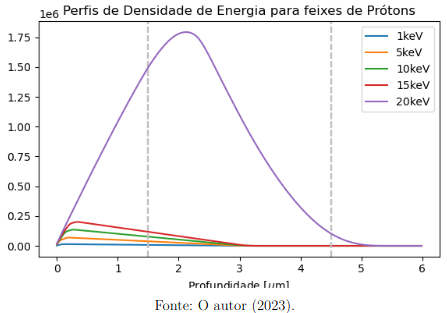
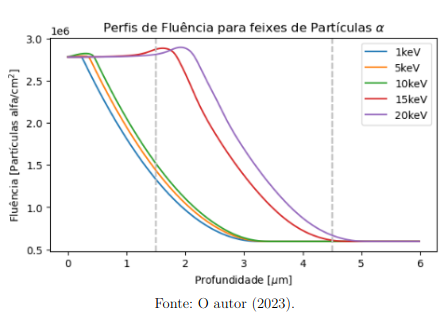
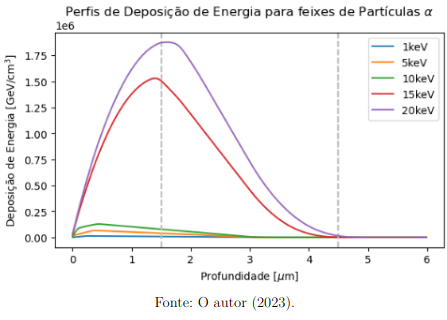
I have some graphs with comparisons of simulations (10⁸ primary) for beams of alpha particles and also for protons with energies of 1, keV, 5 keV, 10 keV, 15 keV and 20 keV. The detectors used were two USRBIN configured to record the fluence and another the dose. my inputs are attached to this link: Measurement units.
I would like to ask what would be the apparent reason for the fluence for 20 keV protons to be so far from that of 15 keV. And in the case of the registered DOSE, the 20 keV dose also differs much more, is this correct?
For alpha particles, 15 keV and 20 keV beams also differ more than other energies.
and also… do these units of measurement seem right?
thank you very much.
Hopefully you are actually running a different input, as modified by @dprelipc to lower the proton/alpha transport threshold down to your energies.
The discrepancy you observe for 20 keV is not correct and looks likely due to the fact that you input … 200 keV instead.
By the way, your scoring is rather misleading, because, due to the spherical geometry and your beam profile, beam particles travel a different path in vacuum before entering the material cell.
As for the scored quantity units, they are right. What is questionable are the corresponding values, resulting from a doubtful beam profile, namely a blade of zero vertical thickness that by definition gives a dose arbitrarily depending on the vertical scoring resolution and increasing to infinite for decreasing vertical bin size.