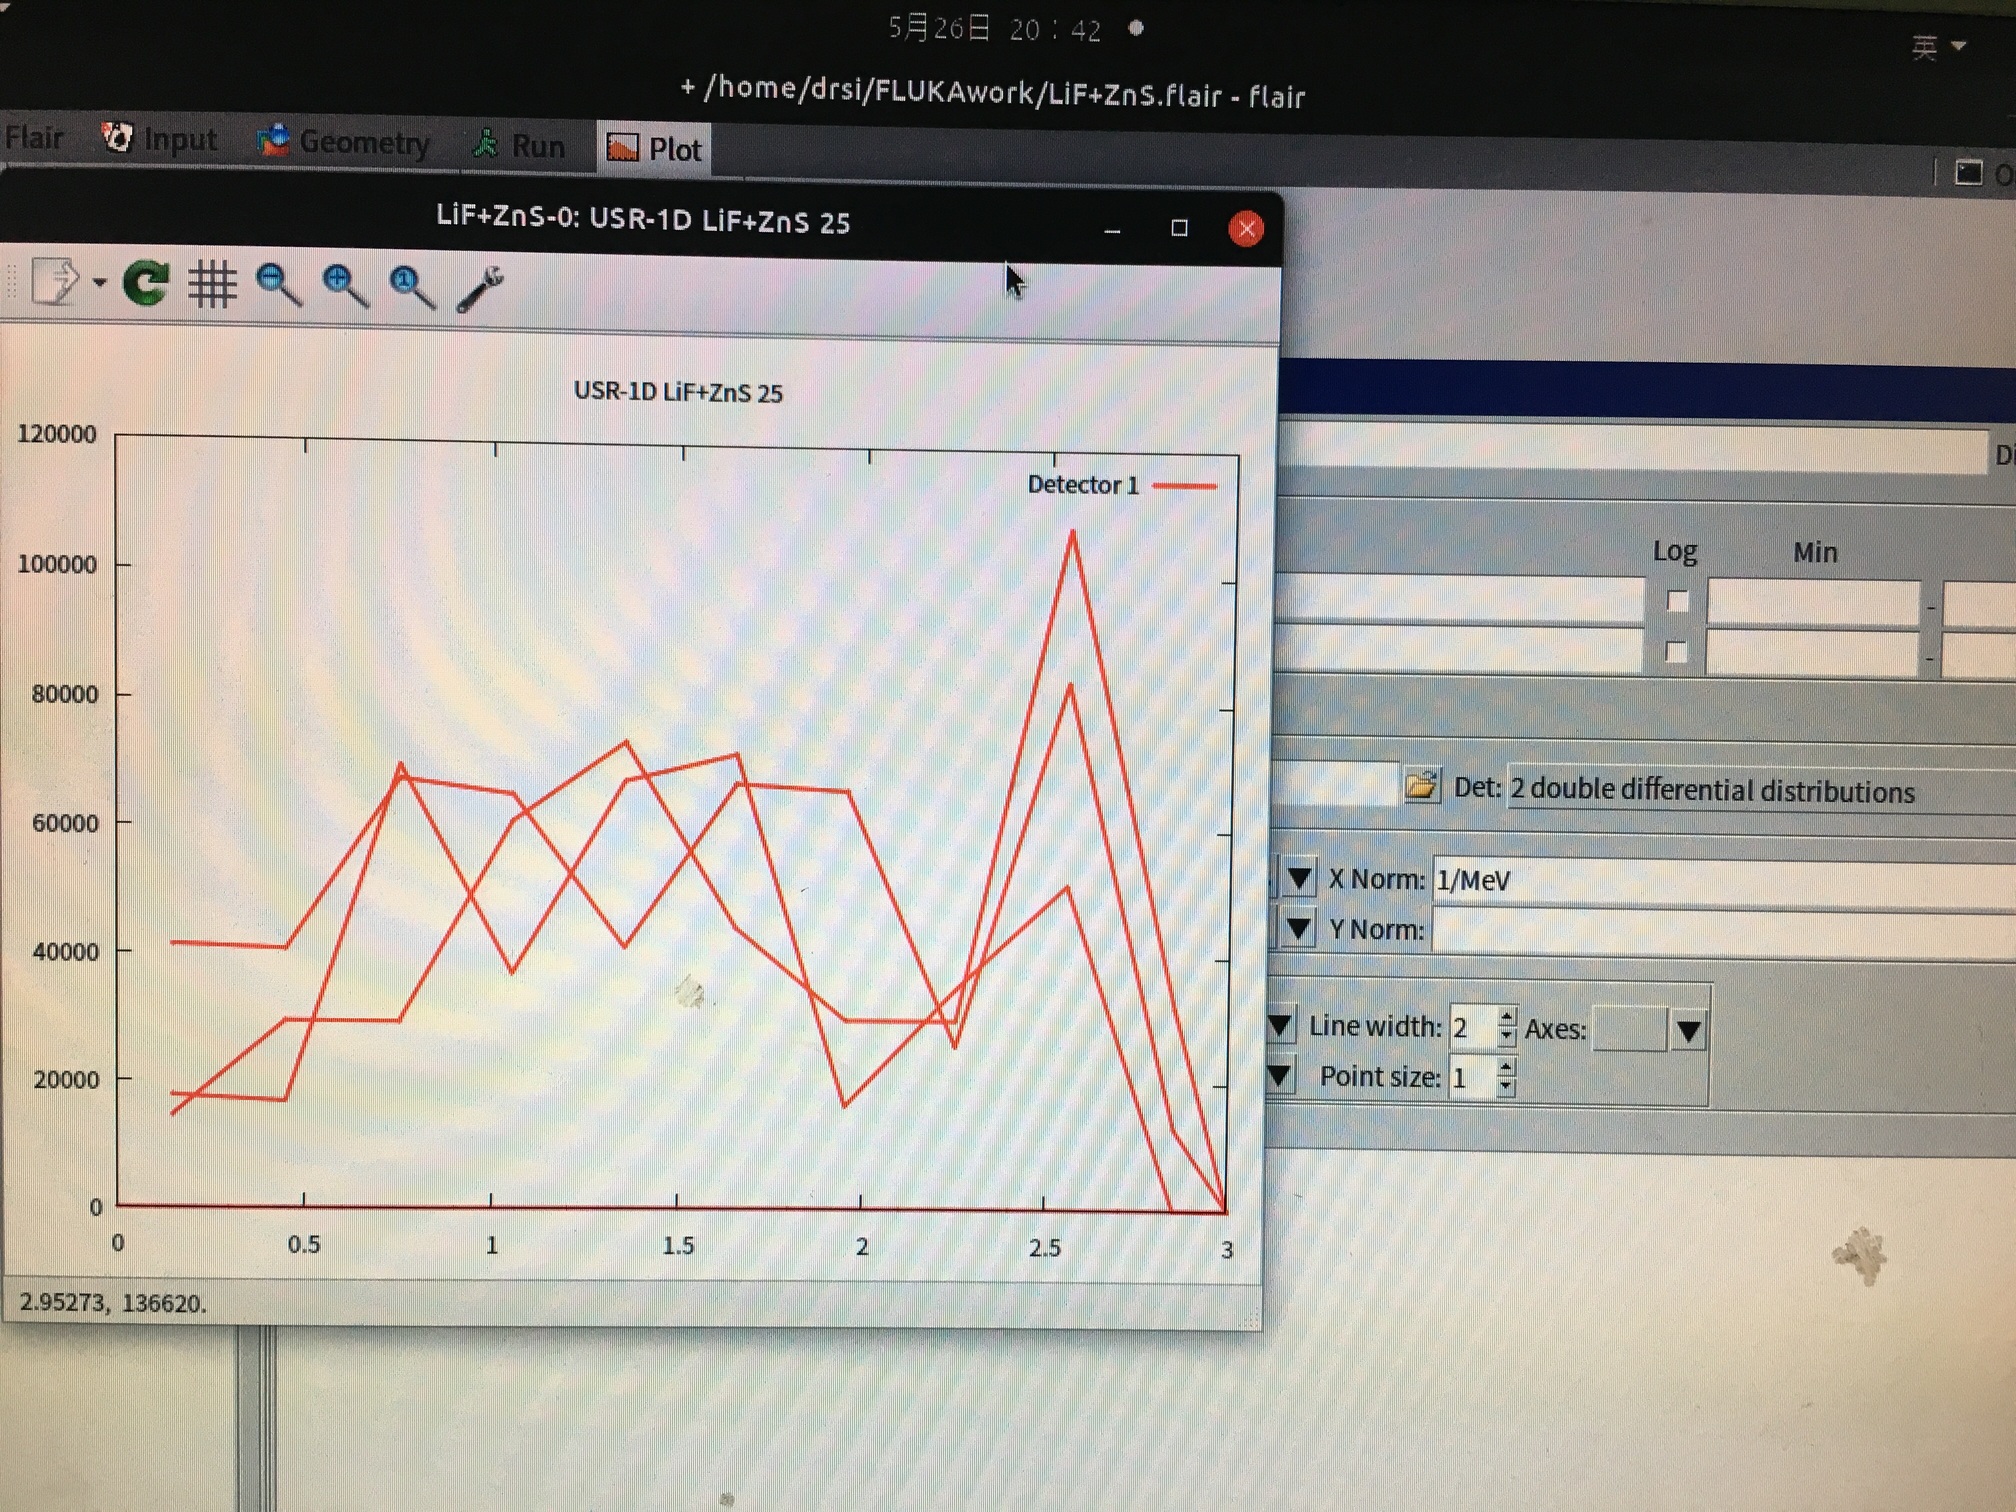
Doing that plot, you should observe the spectra at different angles, depending of the number of angular bins that you selection in you USRBDX card. I see that you used 2 in your input file. It means that you should be looking only the superposition of two graphs, then… it’s weird that you are getting three.
Anyway, I modified your input file a little bit in order to obtain a cleaner result: LiF+ZnS.flair (4.9 KB)
Here the most important changes:
Changed the USRBDX linE → logE
I changed the number of cycles to 5: It’s always recommended to choose a value above 5 ( 5-10 is ok) in order to have good statistics.
I added a few plots: For triton and 4He, the superposition of the two distributions (in different colors) obtained for the different angles, and the integrated case.
You will see also that I selected the ‘Lethargy plot’ ( < X >*Y). Considering that we have chosen log(E) for the scoring, it’s important to use the lethargy plot in order to avoid misleading regarding to the contribution according to the energy, i.e. doing this plot you are assigning the correct importance to different energy ranges in the plot. This thread is also related to this.
Dear @adonadon
Thank for your help,I am sorry for late and a little confused about plot value too.
please help me to see below right or not:
Y=dN/dE,(cm^-2* GeV^-1)
< X>* Y=dN/dlogE=E* dN/dE,(cm^-2)
DX*Y=dE *dN/dE=dN,(cm^-2)
if it is right,at the second formula,“dE” represent every energy bin of x-axis,then what is “E” represent?
I want to get the relationship between every energy bin and counts,so should I choose DX *Y?
What you are describing there is correct.
But let’s define ‘dE’ and ‘E’ properly:
dE is the width of the bin (energy in our case)
E (or better ‘< E >’ ) is the average value of the bin, i.e. In our case is the average energy of the bin
I’m not sure If I understand what you say with ‘relationship between every energy bin and counts’.
But, If it means that you are looking for the number of count, in a particular < E > in an energy bin,
your option is Y * < X >. Which is also recommended due to the nature of your simulation (low energy neutrons). More info. here (pag. 28/30)
In the case of Y*DX, you get the value of fluence per energy interval in units of counts/cm^2/primary, because you are integrating the spectrum. The problem is that you would not obtain any relevant information from the plot (the values could be useful, of course) due to the fact that the plot varies arbitrarily with the DX=dE bin width
If Y-axis choose Y,it equal to dn/dE,the area of the graph is dn1/dE1* dE1+dn2/dE2* dE2+…=N;
If choose < x > y,it equal to Edn/dE,the area of the graph is E1* dn1/dE1* dE1+…=sum(Ei* dni) may be meaningless?
If choose DX* Y,it equal to dE* dn/dE=dn,the area of the graph is dn1* dE1+dn2* dE2+…,still meaningless?
What I want to get is the relationship of a specific energy value and its count,maybe I should choose < X >* Y from your help ,but I feel that the formula is not represent what it really express.
It’s not meaningless if your x = E axis is set on logarithmic scale, since in this case the area of the graph becomes actually the sum of (Ei * dni/dEi) * dlogEi = dni/(dEi/Ei) * dlogEi = dni/dlogEi * dlogEi = dni, which is as it should be.
Dear @ceruttif ,
So,that is to say if X-axis is E,Y-axis should choose Y;if X-axis is logE,Y-axis should choose < x > y,they express the same meaning, and DXY maybe used in another special case,right?