I have a question regarding neutron spectrum scoring from an Am-Be source.
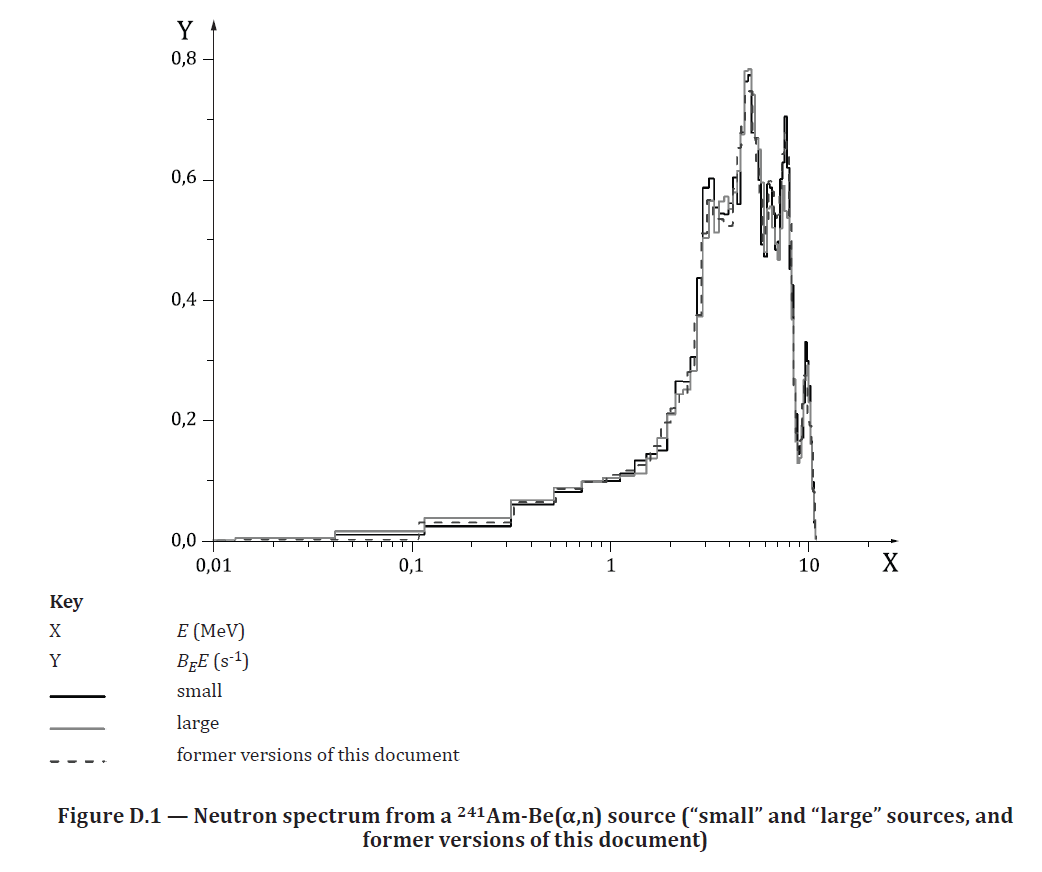
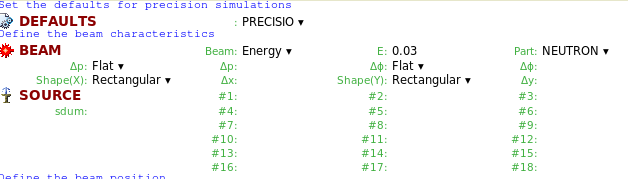
I am simulating an Am-Be source whose emission spectrum is defined according to ISO 8529-1. The source spectrum is sampled through source_newgen.f.
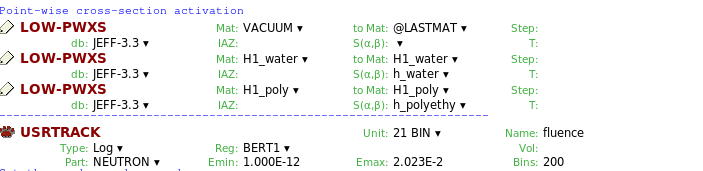
The geometry includes the source capsule and all surrounding structural elements of the irradiation facility. I score the neutron energy spectrum at a distance of 200 cm from the source using a spherical detector region with USRTRACK.
The resulting spectrum exhibits an unexpected depression around 1-2 MeV, as shown in the figure below. The feature appears only for certain energy binnings. For example, when using 200 logarithmically spaced bins, a clear depression is visible in the 1-2 MeV region. If I change the number of bins, the spectrum becomes much smoother and the depression essentially disappears.
I am trying to understand whether there is a physical reason behind this feature or a bug in the code/methodology.
I have already investigated the materials that neutrons traverse between their production region and the scoring location. None of the materials involved seem to exhibit pronounced structures in their neutron cross sections that could explain a depression in this energy range.
I also came across a previous discussion on the forum where there was an unexpected feature around 1 MeV:
Although that discussion concerned a different problem, it made me wonder whether the feature observed here could also be related to some numerical effect, transport treatment, or data processing issue.
As for the input file, it reproduces the whole irradiation facility with a very complex geometry, so I am attaching only the parts relevant to the scope of my question:
I am also attaching the .lis file obtained as output of the USRTRACK with the simulation (this is with 500 bins, but with 200 bins or 500 bins I get the same issue). To plot the spectrum in lethargy scale, I take the value in the third column, multiply it by dE = Emax - Emin, and then divide by ln(Emax/Emin). I was wondering whether the issue might be in this post-processing. Irradiation_21_tab.lis (29.9 KB)
Update: I have realised that the input spectrum provided in “AmBe_Large.txt” contained a small typo in the intensity, exactly around 2 MeV. I am now running new simulations to confirm whether this is really the origin of the depression around that energy. I will report back as soon as I have the results.
I can confirm fixing the typos in the two lines covering the energy range between ~2 and 2.35 MeV fixes the spectrum.
For the lethargy plot you only need to multiply the FLUKA result with the (geometric) average energy of the bin. In Flair you can do this by selecting the <X>*Y option for Value.