Dear Fluka Experts,
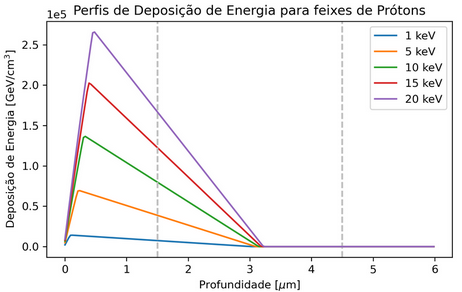
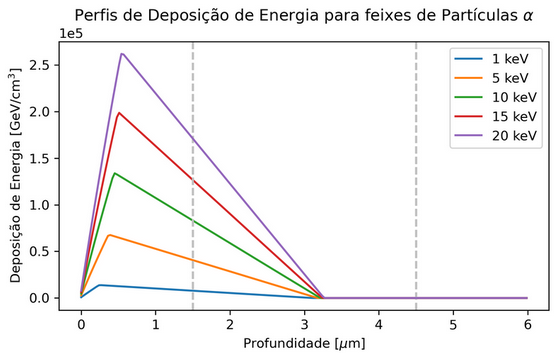
I performed simulations with alpha particles and protons. I got results indicating that beams of alpha particles with the same energy as beams of protons are penetrating deeper into the cell. Do you know a reason for this? Something I’m doing wrong? I used the USRBIN detector to capture the DOSE.
My inputs are at this link: Measurement units.
But I have the following graphs:
Thank you very much for your help, I apologize for the difficulty in explaining.
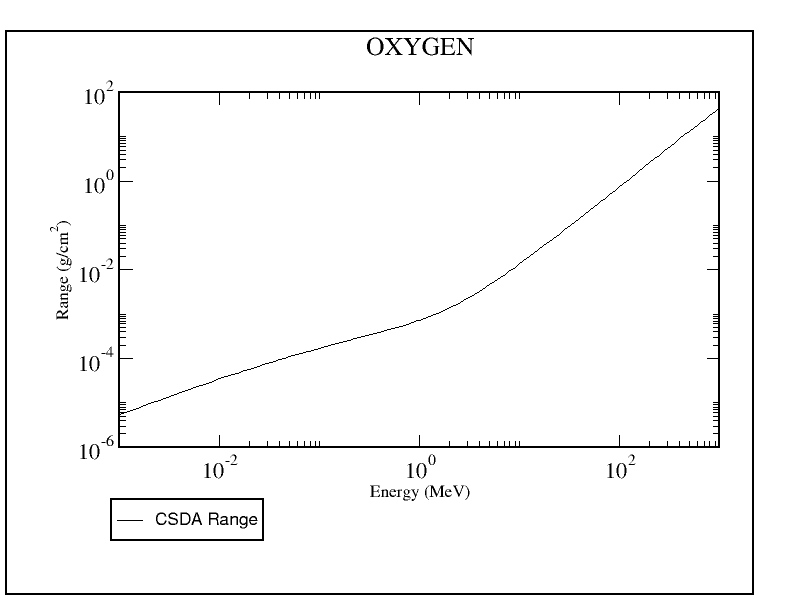
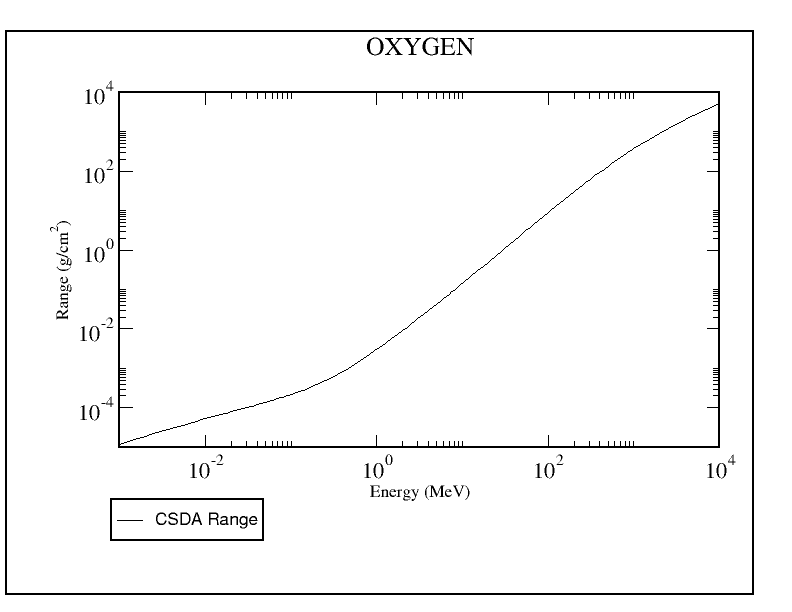
Although fort most energies alphas have a penetration depth shorter than protons, your scenario is at low energies (keV), where actually alphas have a slightly larger penetration depth compared to protons. See for example these plots below from the NIST database.
However, please note the following given the scale of your simulation (micrometers):
I suggest to adjust the physics settings to the lowest energy possible, otherwise you might have artefacts as your plots indicate (please find attached your updated inp file with MULSOPT and PART-THR cards. 20kev.inp (3.6 KB)
From the PART-THR card documentation, you will find an explanation for the right half of your plot (the descending slope): When the energy of a heavy charged particle becomes lower than the cutoff defined by PART-THRes, and if such cutoff is lower than 100 MeV, the particle is not stopped, but is ranged out to rest in an approximate way. Its kinetic energy is deposited uniformly over the residual range if the latter is contained within a single region.
Thank you so much for the answer, it helped a lot!
I inserted MULSOPT and PART-THR cards, I also inserted a DELTA RAY card, but I don’t know exactly how to define ‘E Thers’.
my objective is simple, to compare the energy deposition and production of secondary particles with alpha particles and with protons impinging on a generic cell, but I am having difficulties in how to interpret the results. Can you help me?
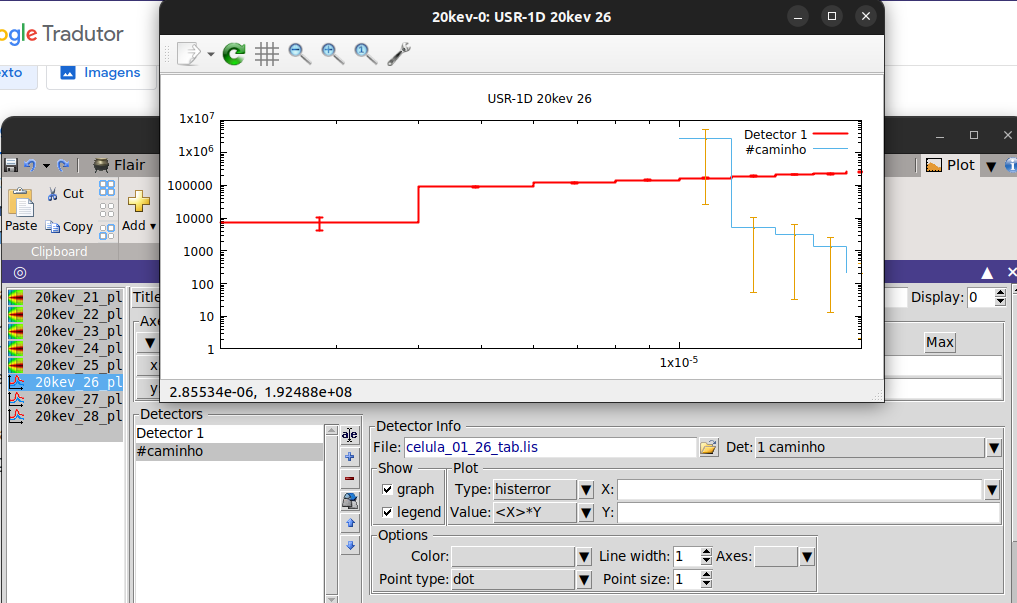
Especially, how I interpret the USR-1D results with the .tab.lis files and the meanings of the axes and their respective measurement units.
thanks again!
He4 input: 20kev.inp (3.9 KB) 20kev.flair (4.2 KB)
Proton input: 20kev.inp (3.9 KB) 20kev.flair (5.9 KB)
The DELTARAY card would maybe be not needed in your case, as at these low energies more complex processes dictate their production at lower energies (see for example section 2.2. of this paper). The E thres defines the threshold energy above which secondary electrons (delta rays) are explicitly produced. The lower you define this threshold energy the more electrons will be produced and more computational time will be needed, and it should be above the electron transport threshold. However, given your small scale, I would also suggest an EMFFIX card to reduce the step length: EMFFIX CITO .01 CLO .01
To compare the energy deposition, you would only require the USRBIN cards. I noticed that you set only one bin in the X direction, but you should also add a granularity there as well, otherwise your results will be averaged over the entire X-slice of the sphere.
Regarding the USR-1D from the USRTRACK card, you are scoring particle fluences. On the x-axis you have the particle energies, while on the y-axis you have the particle fluence (see slides 31 and 32 for more info about fluence in this presentation). From the FLUKA manual: Important: The results of USRTRACK are always given as differential distributions of fluence (or tracklength, if the detector region volume is not specified) in energy, in units of cm-2 GeV-1 (or cm GeV-1) per incident primary unit weight.