Unsymmetrical results in symmetrical geometry

Dear FLUKA Experts,

In the attached input file, I want to score Dose-Eq. at z=56 (top surface) of the geometry. I used four USRBIN cards:

  1. x-y-z, z= 56 to 57, y = -0.5 to 0.5, x = -59.5 to 59.5 (119 bins), Volume of one bin: 1cc
  2. x-y-z, z= 56 to 58, y = -1 to 1, x = -59 to 59 (59 bins), Volume of one bin: 8cc
  3. x-y-z, z= 56 to 57, x = -0.5 to 0.5,y = -59.5 to 59.5 (119 bins), Volume of one bin: 1cc
  4. x-y-z, z= 56 to 58, x = -1 to 1,y = -59 to 59 (59 bins), Volume of one bin: 8cc

40sources.f (15.2 KB)
TestFile.inp (25.3 KB)

The dose-eq. values near the air gap (i.e., x = 32.5 to 32.7 and x = -32.5 to -32.7) have increased suddenly to very large value (e.g, from 0.00026mR/h to 0.00268mR/h). Also, the values at x = -32.6 are not same as the values at x = 32.6 even when the geometry is symmetrical.

Dose-Eq_Values.pdf (661.0 KB)

First, I kept 25 source pencils (odd number), the values were different at x = 32.6 and -32.6. So, I kept 40 pencils (even number), then also values are different. I even tried increasing the NPS from 5E07 to 2E08, but values are still different. Why is it so?

What can I do to improve the values (I already tried increasing bin volume and NPS)?

Please guide.

Dear @jyoti.grg,

You are in the same situation you were in February (Relation between errors in successive scoring bins).

1-As I already told you, you should not use X-Y-Z USRBIN having 1 single bin in two dimensions, create instead a X-Y-Z USRBIN that while having 1 bin in z can instead create an overview of the the whole plane you are interested into.

2-Since your system has radial symmetry and your interest in a value at a specific radius, you should use a R-PHI-Z USRBIN. If you set R between 32.5 and 32.7 cm with PHI between 0 and 2pi, you will have a nice radial plot at a given z that will use all the particles going through the radii of interest over the whole circumference and not just over a small section of it. If you want to check that the results are radially symmetrical you can set a small number of bins in PHI.

3-Once again, don’t look only at the raw data but have also a look at the plots of the USRBINs.

4-The increase in the dose rate value is due to the fact that your geometry has a radial air gap precisely for that radius, just below the z where you want to score.

Dear Expert

  1. I was scoring From -x to +x and -y to +y, I kept a single usrbin from x = -59 to 59 (at the whole plane) and I kept two different usrbin at x = -32.1 to -33.1 and x = 32.1 to 33.1. The results are asymmetrical in both the cases. There is a sudden increase in DOSE EQ values near the air gap (and respective error percentage too).

  2. I kept the R-phi-Z USRBIN and checked the radial symmetry with small number of bins. The values are very much higher than expected and asymmetrical.

  3. The x-z plot obtained is:

                                           z-axis
    
  4. The sudden increase in the dose rate is very high. In addition, the error percentage is high so I am not able to understand whether the values are correct. I tried increasing bin volume and NPS to 2E08 with 7 cycles 12 spawns, still the error is large.

Please help me to solve this problem.

With regards,
Jyoti

Dear @jyoti.grg,

I have run your input with 30 million primaries after having add a few USRBINs to it.
I added a large Cartesian USRBIN to look at the particle fluence:

 USRBIN           10.  ALL-PART       -24        50        50        60ap        
 USRBIN           -50       -50        20       100       100        40 &        

At first, I checked that your source was as I was expecting it (i.e. source made of 40 rods). I plot in the geoviewer the large Cartesian USRBIN on a x-x plane and at z=20.5

image

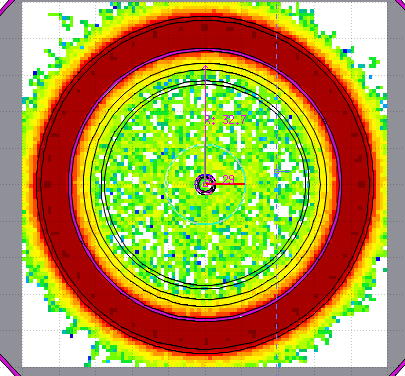
This seemed to me quite reasonable and shows well a radial symmetry.

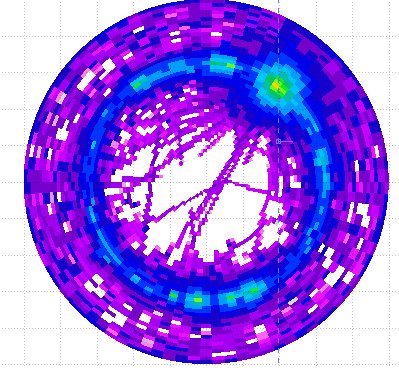
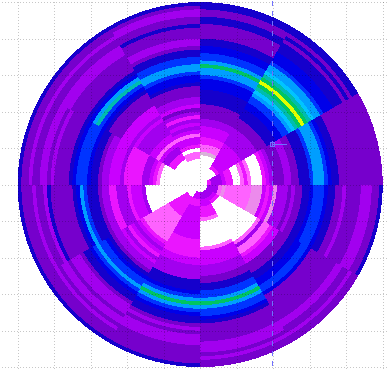
Then I looked at the particle fluence at z=56.5 again on the x-y plane:

image

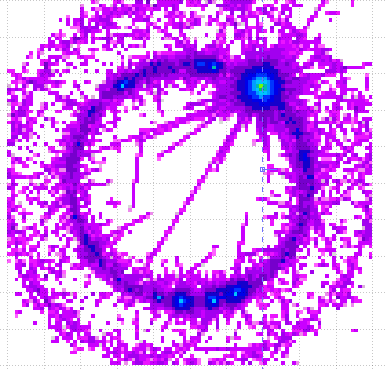
This clearly indicates that the problem has lost its radial symmetry.

Naturally, the same appears also if I look at the ambient dose equivalent rate:

image

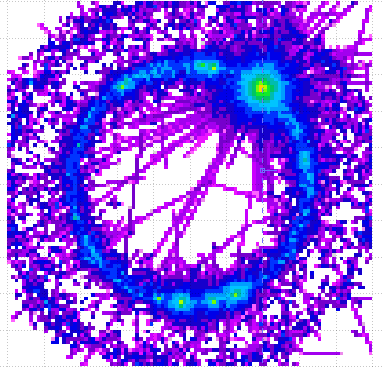
In this case I have added a dedicated Cartesian USRBIN:

 USRBIN           10.   DOSE-EQ       -23        50        50       58.xyz       
 USRBIN           -50       -50       56.       100       100        1. &        

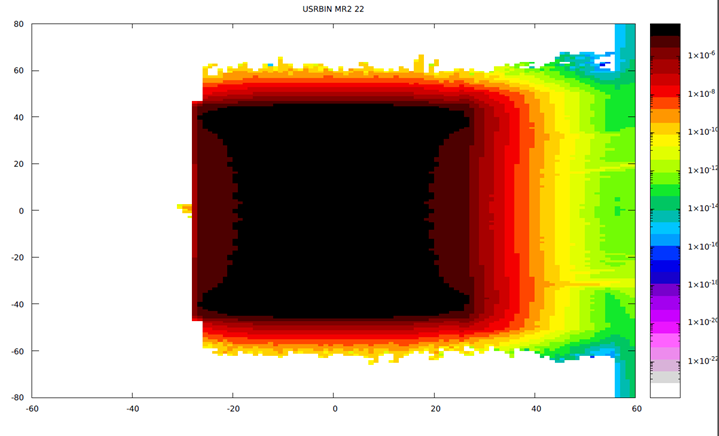
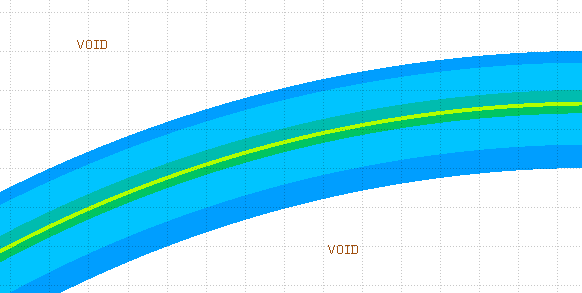
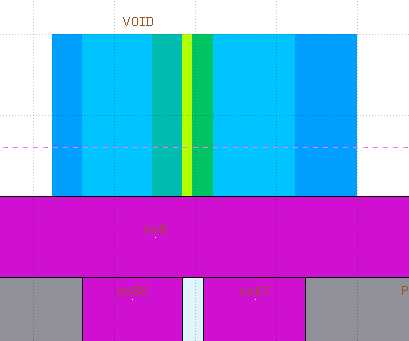
In order to understand what was going on, I looked then again at the particle fluence, but this time on the y-z plane and setting x to correspond to the hot spot I had seen before:

image

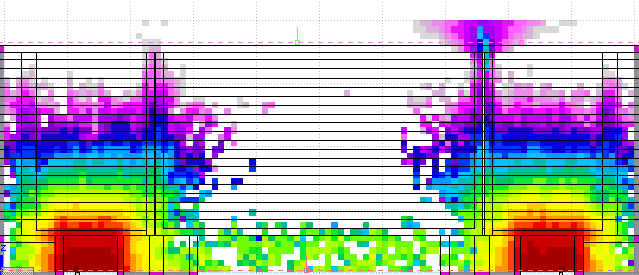
As can be expected, the lead and stainless steel provide a good shielding and very little particle go through. The radiation escapes more easily through the small air gaps. Here, we can even see that an interaction takes place close to the end of the gap and this generates some extra shower (remember that we’re just looking at the particle fluence).

At this point, it’s possible to draw an important conclusions: my simulation (30 million primaries) clearly doesn’t have enough statistics.
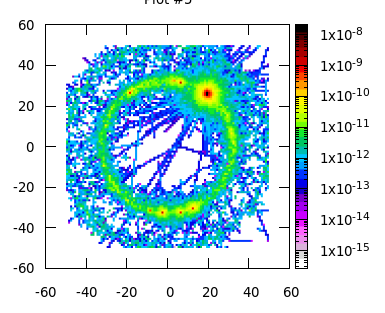
This can be seen also with plots in the plot tab. First I plotted the ambient dose equivalent rate:

image

and then I plot the uncertainty on it:

image

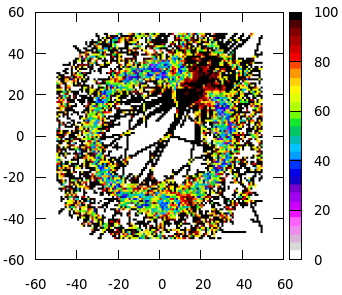
From this last plot, one can infer 2 things:
1-in the ring around the gap, the statistical uncertainty around 50%
2-the hot spot has an uncertainty of almost 100%, which means it’s caused by a fluctuation.

I had also added some R-PHI-Z USRBIN scorings, with a different number of radial bins:

 USRBIN            11   DOSE-EQ       -23        50         0       58.rphz90    
 USRBIN             0         0       56.        50        90        1. &        
 USRBIN            11   DOSE-EQ       -23        50         0       58.rphz12    
 USRBIN             0         0       56.        50        12        1. &        

In this way I could still check the radial symmetry while exploiting the symmetry of the experimental setup:

image

image

I also added 1 R-PHI-Z scoring with a single angular bin:

 USRBIN            11   DOSE-EQ       -23        34         0       58.rphz1gap  
 USRBIN            31         0       56.        30         1        1. &        

which I can of course plot with an extreme zoom (over different planes)
image

image

but most interestingly, I can plot over 1 dimension:

image

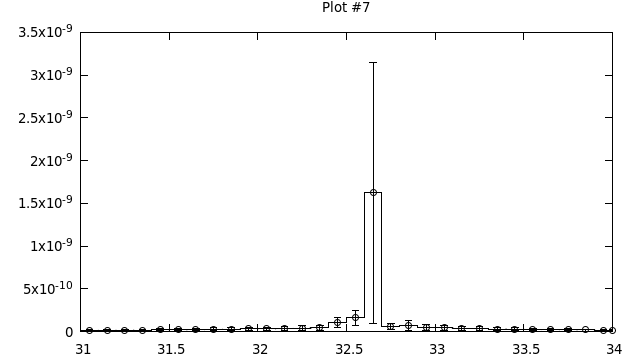
which also indicates that my simulation doesn’t have enough statistics.

Now, let’s go back to your simulations and your results:

  • I don’t know how many primaries you ran, but I would say that they were not enough. You need to improve the statistics over your Region Of Interest, either increasing the number of primaries or in some other ways.

  • In this case, using a USRBIN which has 1 bin over 2 coordinates is not a commendable thing to do. You are not gaining anything in terms of CPU time, on the contrary you are losing the data and the opportunity to monitor the overall behavior of your simulations. Using such USRBIN to claim that the system lacks of symmetry is pointless.

  • Using a R-PHI-Z USRBIN allows to exploit the radial symmetry of the system and somewhat to reduce the statistical uncertainty.

2 Likes

A post was split to a new topic: How to estimate the rise temperature of a material