Dear FLUKA experts, I designed a beam dump and I want to do thermal analysis. I use usebin to calculate the energy deposition and I times the right time. But I don’t know how can I export the result and use ANSYS to do the thermal analysis.Could you give me some suggestions?
Thank you very much.
Beam Dump by Nicolas.flair (3.0 KB)
Dear @Nicolas_Zhou,
You can export the results of the USRBIN into ascii format using flair, in the “Run tab”, “Files view”, with the “-> ascii” button.
Then it is up to you and the person who will perform the ANSYS calculation, to manipulate the text file in order to generate something that is usable by ANSYS.
Dear @amario ,I follow your suggestion use ascii button and I produce 3 new files.
As you can see in the picture, I want to know the whole 3D energy deposition but I cannot find it.
In the files I found many datas but it it a little bit difficult to know what is what.
For example,
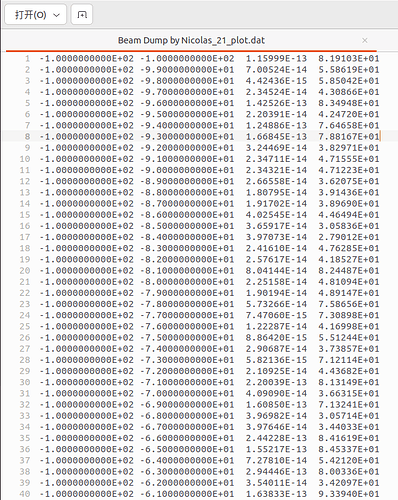
this file shows the energy deposition , the first column is z,the second column is x, the third column is the energy deposition while the last is error. But how can I get the 3D distribution?
It maybe in the geo.dat but I cannot know what every column is.
So which file can I use to do my job?
I really appreciate if you could help me.
Thanks.
You should consider the bnn.lis file.
There energy deposition density values [GeV/cm^3 per primary proton] are listed row-by-row, with no explicit info on x/y/z. The first value refers to the first bin of the mesh (i=1,j=1,k=1), where i,j,k are the bin index in x/y/z. Then i is looping first, j second and k last. In your case, the first 200 values (in the first 20 rows) refer to j=k=1 (-100<y,z<-99), with i running from 1 (-100<x<-99) to 200 (99<x<100), and so forth.
Note that on the transverse x/y dimensions, one should better ask for an odd number of bins, in order to get a central bin around x=y=0 and so avoid to underestimate the maximum energy deposition inside the beam core.
Dear @ceruttif
I set the mesh 200×200×200, it should have 8E6 energy deposition density values [GeV/cm^3 per primary proton] .But I have 1.6E6 rows with each row has 10 datas , it will have 1.6E7 values. What dose the extra 8E6 values means?
Respective statistical error in percentage, as written in the middle of the file, before the error matrix starts.
Dear @ceruttif
Okay, I have solve the question.
Thank you very much!

